29
/
en
AIzaSyAYiBZKx7MnpbEhh9jyipgxe19OcubqV5w
April 1, 2024
153182
Hungary
HUN
true
2
1
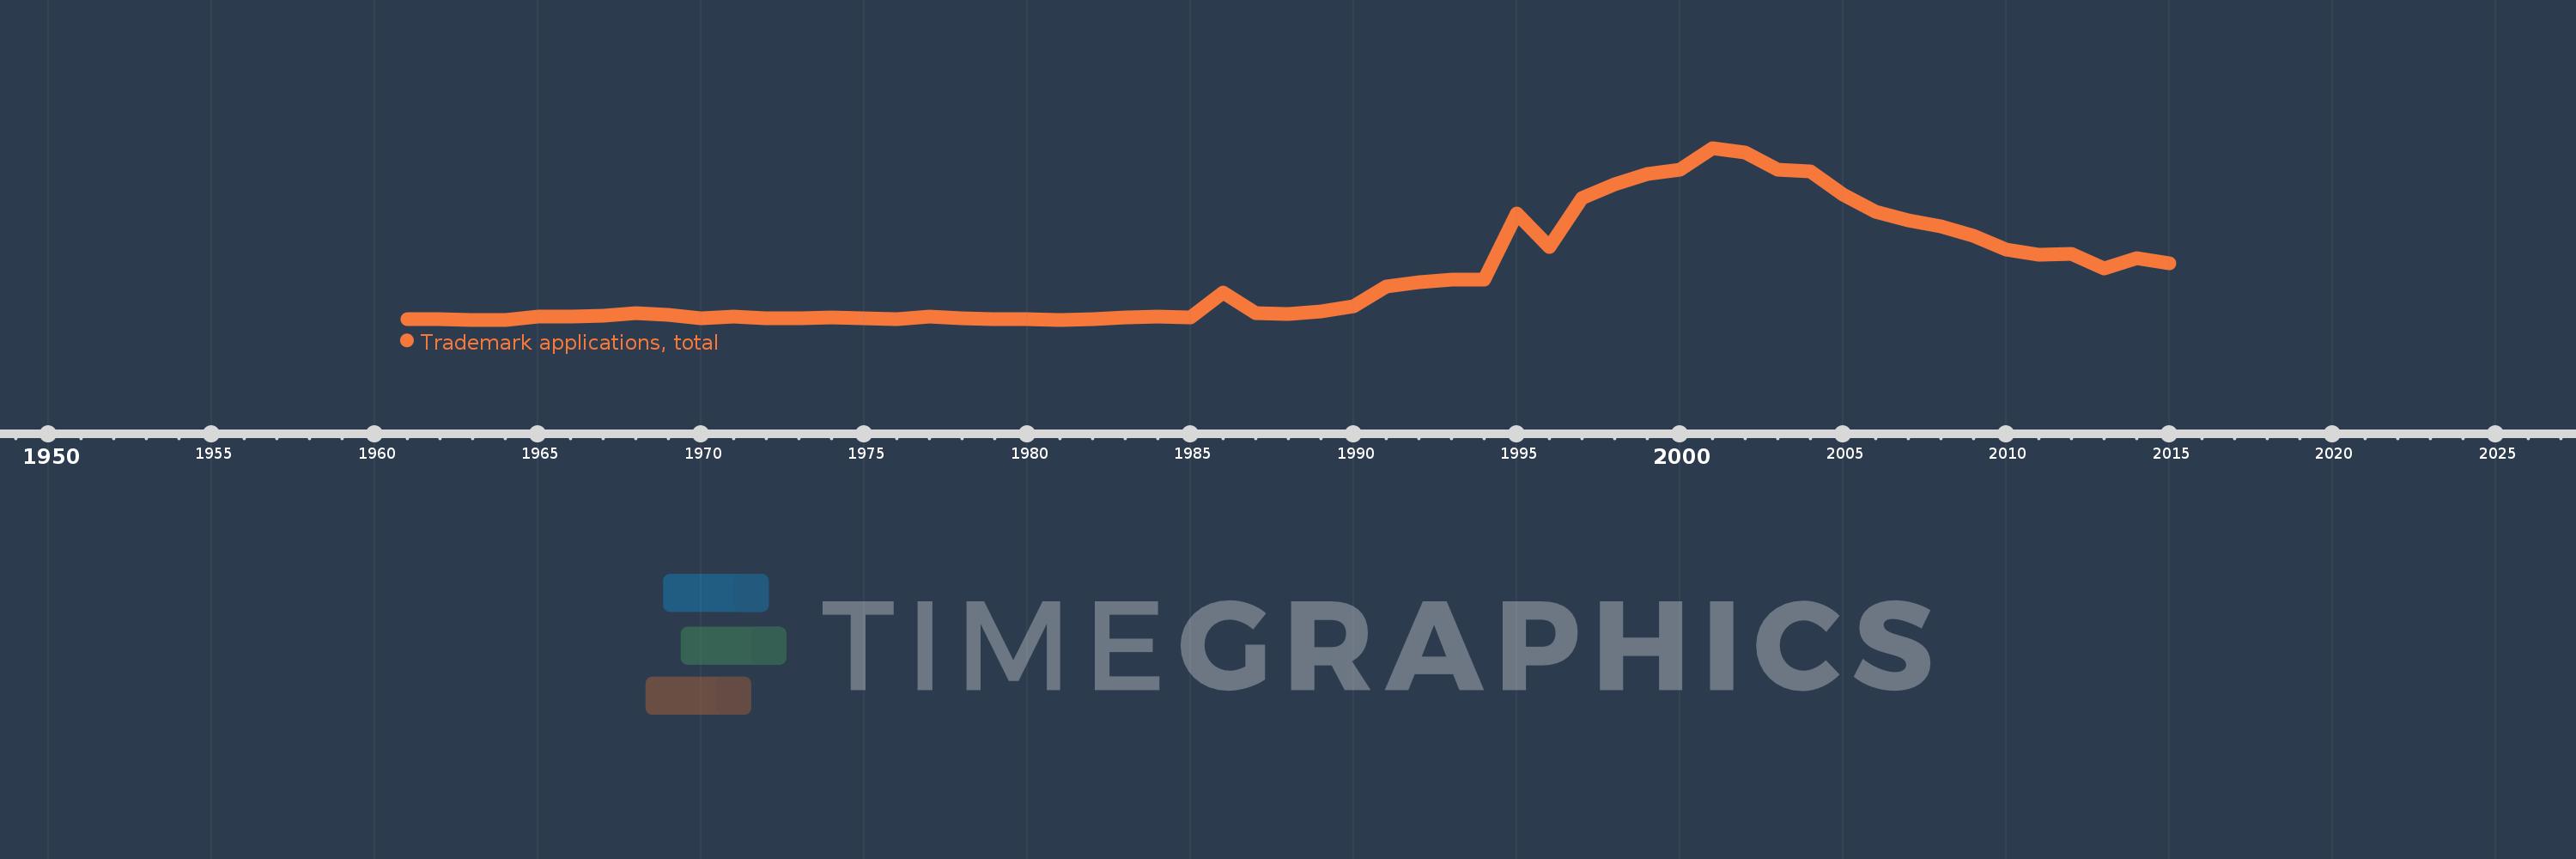
Trademark applications, total
2015,2014,2013,2012,2011,2010,2009,2008,2007,2006,2005,2004,2003,2002,2001,2000,1999,1998,1997,1996,1995,1994,1993,1992,1991,1990,1989,1988,1987,1986,1985,1984,1983,1982,1981,1980,1979,1978,1977,1976,1975,1974,1973,1972,1971,1970,1969,1968,1967,1966,1965,1964,1963,1962,1961
This statistics in other country:
AlbaniaAlgeriaAndorraAngolaAntigua and BarbudaArab WorldArgentinaArmeniaArubaAustraliaAustriaAzerbaijanBahamas, TheBahrainBangladeshBarbadosBelarusBelgiumBelizeBhutanBoliviaBosnia and HerzegovinaBotswanaBrazilBrunei DarussalamBulgariaBurkina FasoBurundiCabo VerdeCambodiaCanadaCaribbean small statesCentral Europe and the BalticsChileChinaColombiaComorosCongo, Dem. Rep.Costa RicaCroatiaCubaCuracaoCyprusCzech RepublicDenmarkDjiboutiDominicaDominican RepublicEarly-demographic dividendEast Asia & PacificEast Asia & Pacific (excluding high income)East Asia & Pacific (IDA & IBRD countries)EcuadorEgypt, Arab Rep.El SalvadorEquatorial GuineaEstoniaEthiopiaEuro areaEurope & Central AsiaEurope & Central Asia (excluding high income)Europe & Central Asia (IDA & IBRD countries)European UnionFijiFinlandFranceGambia, TheGeorgiaGermanyGhanaGreeceGrenadaGuatemalaGuineaGuinea-BissauGuyanaHaitiHigh incomeHondurasHong Kong SAR, ChinaHungaryIBRD onlyIcelandIDA & IBRD totalIDA blendIDA onlyIDA totalIndiaIndonesiaIran, Islamic Rep.IraqIrelandIsraelItalyJamaicaJapanJordanKazakhstanKenyaKiribatiKorea, Dem. People’s Rep.Korea, Rep.KuwaitKyrgyz RepublicLao PDRLate-demographic dividendLatin America & Caribbean Latin America & Caribbean (excluding high income)Latin America & the Caribbean (IDA & IBRD countries)LatviaLeast developed countries: UN classificationLebanonLesothoLiberiaLibyaLiechtensteinLithuaniaLow & middle incomeLower middle incomeLuxembourgMacao SAR, ChinaMacedonia, FYRMadagascarMalawiMalaysiaMaldivesMaliMaltaMauritiusMexicoMiddle East & North AfricaMiddle East & North Africa (excluding high income)Middle East & North Africa (IDA & IBRD countries)Middle incomeMoldovaMonacoMongoliaMontenegroMoroccoMozambiqueMyanmarNamibiaNepalNetherlandsNew ZealandNicaraguaNigeriaNorth AmericaNorwayOECD membersOmanOther small statesPacific island small statesPakistanPanamaPapua New GuineaParaguayPeruPhilippinesPolandPortugalPost-demographic dividendQatarRomaniaRussian FederationRwandaSamoaSan MarinoSao Tome and PrincipeSaudi ArabiaSerbiaSeychellesSierra LeoneSingaporeSint Maarten (Dutch part)Slovak RepublicSloveniaSmall statesSolomon IslandsSomaliaSouth AfricaSouth AsiaSouth Asia (IDA & IBRD)SpainSri LankaSt. LuciaSt. Vincent and the GrenadinesSudanSurinameSwazilandSwedenSwitzerlandSyrian Arab RepublicTajikistanTanzaniaThailandTongaTrinidad and TobagoTunisiaTurkeyTurkmenistanTuvaluUgandaUkraineUnited Arab EmiratesUnited KingdomUnited StatesUpper middle incomeUruguayUzbekistanVenezuela, RBVietnamWorldYemen, Rep.ZambiaZimbabwe Timeline:
This timeline shows a graph from 1961 to 2015 of Hungary. No data until 1960. Number of actual observations by date: 55.
Source name:
World Development Indicators
Source organization:
World Intellectual Property Organization (WIPO), World Intellectual Property Indicators and www.wipo.int/econ_stat. The International Bureau of WIPO assumes no responsibility with respect to the transformation of these data.
Categories, topics:
Science & Technology
Last updated:
apr 23, 2017
Indicators value changes by year
Maximum:
15.854K
jan 1, 2001
At the date of observation
Value
Absolute change
Change from previous value
jan 1, 1961
363.0
+363.0
0.0%
jan 1, 1962
396.0
+33.0
9.09%
jan 1, 1963
346.0
-50.0
-12.63%
jan 1, 1964
342.0
-4.0
-1.16%
jan 1, 1965
601.0
+259.0
75.73%
jan 1, 1966
658.0
+57.0
9.48%
jan 1, 1967
679.0
+21.0
3.19%
jan 1, 1968
946.0
+267.0
39.32%
jan 1, 1969
763.0
-183.0
-19.34%
jan 1, 1970
457.0
-306.0
-40.1%
jan 1, 1971
621.0
+164.0
35.89%
jan 1, 1972
506.0
-115.0
-18.52%
jan 1, 1973
455.0
-51.0
-10.08%
jan 1, 1974
515.0
+60.0
13.19%
jan 1, 1975
506.0
-9.0
-1.75%
jan 1, 1976
397.0
-109.0
-21.54%
jan 1, 1977
613.0
+216.0
54.41%
jan 1, 1978
477.0
-136.0
-22.19%
jan 1, 1979
412.0
-65.0
-13.63%
jan 1, 1980
430.0
+18.0
4.37%
jan 1, 1981
341.0
-89.0
-20.7%
jan 1, 1982
411.0
+70.0
20.53%
jan 1, 1983
550.0
+139.0
33.82%
jan 1, 1984
590.0
+40.0
7.27%
jan 1, 1985
549.0
-41.0
-6.95%
jan 1, 1986
2.808K
+2.259K
411.48%
jan 1, 1987
920.0
-1.888K
-67.24%
jan 1, 1988
825.0
-95.0
-10.33%
jan 1, 1989
1.115K
+290.0
35.15%
jan 1, 1990
1.566K
+451.0
40.45%
jan 1, 1991
3.331K
+1.765K
112.71%
jan 1, 1992
3.725K
+394.0
11.83%
jan 1, 1993
3.925K
+200.0
5.37%
jan 1, 1994
3.97K
+45.0
1.15%
jan 1, 1995
9.908K
+5.938K
149.57%
jan 1, 1996
6.932K
-2.976K
-30.04%
jan 1, 1997
11.333K
+4.401K
63.49%
jan 1, 1998
12.606K
+1.273K
11.23%
jan 1, 1999
13.486K
+880.0
6.98%
jan 1, 2000
13.869K
+383.0
2.84%
jan 1, 2001
15.854K
+1.985K
14.31%
jan 1, 2002
15.428K
-426.0
-2.69%
jan 1, 2003
13.862K
-1.566K
-10.15%
jan 1, 2004
13.701K
-161.0
-1.16%
jan 1, 2005
11.637K
-2.064K
-15.06%
jan 1, 2006
10.102K
-1.535K
-13.19%
jan 1, 2007
9.285K
-817.0
-8.09%
jan 1, 2008
8.785K
-500.0
-5.39%
jan 1, 2009
7.903K
-882.0
-10.04%
jan 1, 2010
6.671K
-1.232K
-15.59%
jan 1, 2011
6.182K
-489.0
-7.33%
jan 1, 2012
6.253K
+71.0
1.15%
jan 1, 2013
4.939K
-1.314K
-21.01%
jan 1, 2014
5.905K
+966.0
19.56%
jan 1, 2015
5.438K
-467.0
-7.91%
Ranking of countries by current statistics by years


Comments: