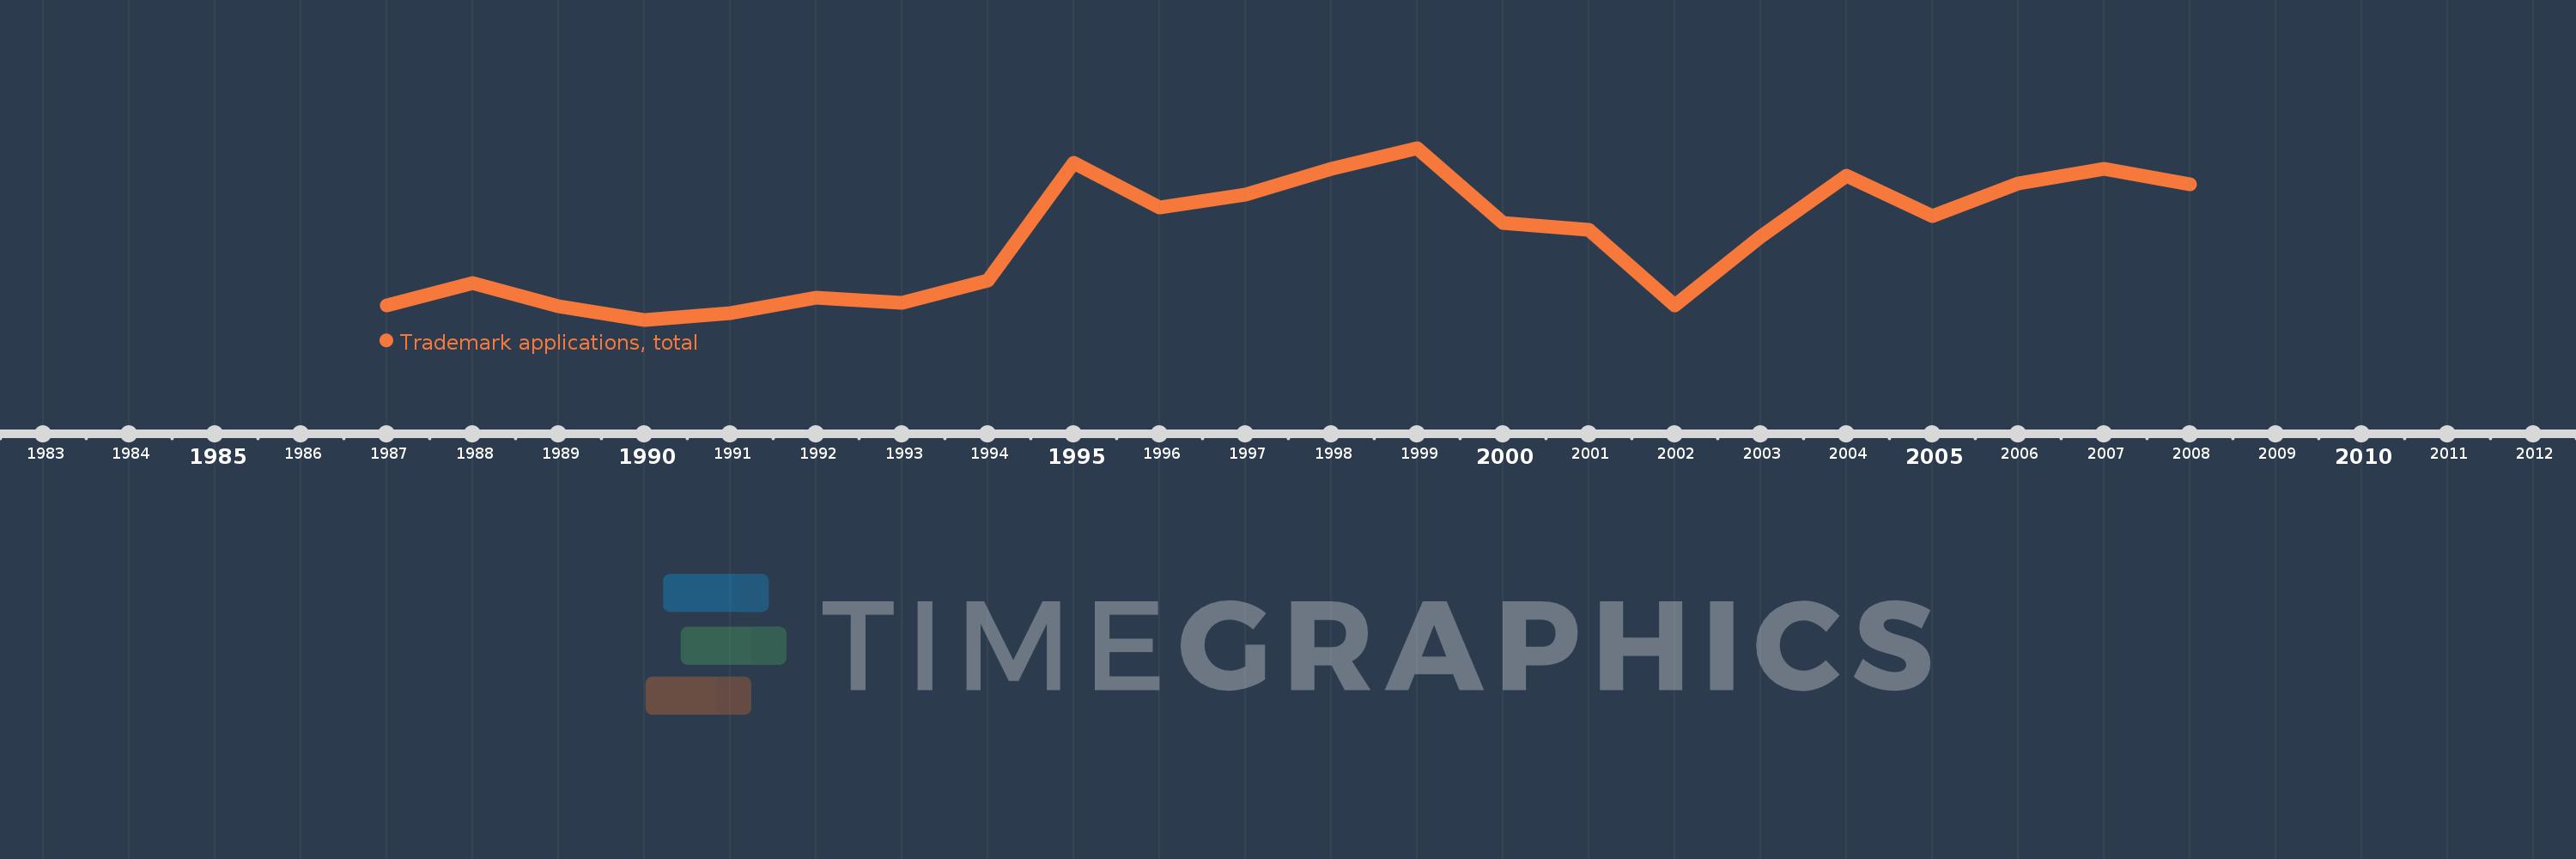
This timeline shows a graph from 1987 to 2008 of Dominica. No data until 1986. Number of actual observations by date: 22.
Source name:
World Development Indicators
Source organization:
World Intellectual Property Organization (WIPO), World Intellectual Property Indicators and www.wipo.int/econ_stat. The International Bureau of WIPO assumes no responsibility with respect to the transformation of these data.
Categories, topics:
Science & Technology
Last updated:
apr 23, 2017
Indicators value changes by year
Meaning:
148.682
Minimum:
62.0
jan 1, 1990
Maximum:
242.0
jan 1, 1999
At the date of observation
Value
Absolute change
Change from the previous value
jan 1, 1987
77.0
+77.0
0.0%
jan 1, 1988
100.0
+23.0
29.87%
jan 1, 1989
76.0
-24.0
-24.0%
jan 1, 1990
62.0
-14.0
-18.42%
jan 1, 1991
69.0
+7.0
11.29%
jan 1, 1992
85.0
+16.0
23.19%
jan 1, 1993
80.0
-5.0
-5.88%
jan 1, 1994
103.0
+23.0
28.75%
jan 1, 1995
226.0
+123.0
119.42%
jan 1, 1996
180.0
-46.0
-20.35%
jan 1, 1997
193.0
+13.0
7.22%
jan 1, 1998
220.0
+27.0
13.99%
jan 1, 1999
242.0
+22.0
10.0%
jan 1, 2000
163.0
-79.0
-32.64%
jan 1, 2001
156.0
-7.0
-4.29%
jan 1, 2002
77.0
-79.0
-50.64%
jan 1, 2003
149.0
+72.0
93.51%
jan 1, 2004
213.0
+64.0
42.95%
jan 1, 2005
171.0
-42.0
-19.72%
jan 1, 2006
205.0
+34.0
19.88%
jan 1, 2007
220.0
+15.0
7.32%
jan 1, 2008
204.0
-16.0
-7.27%
Ranking of countries by current statistics by years
