29
/
en
AIzaSyAYiBZKx7MnpbEhh9jyipgxe19OcubqV5w
April 1, 2024
249567
Sri Lanka
LKA
true
2
1
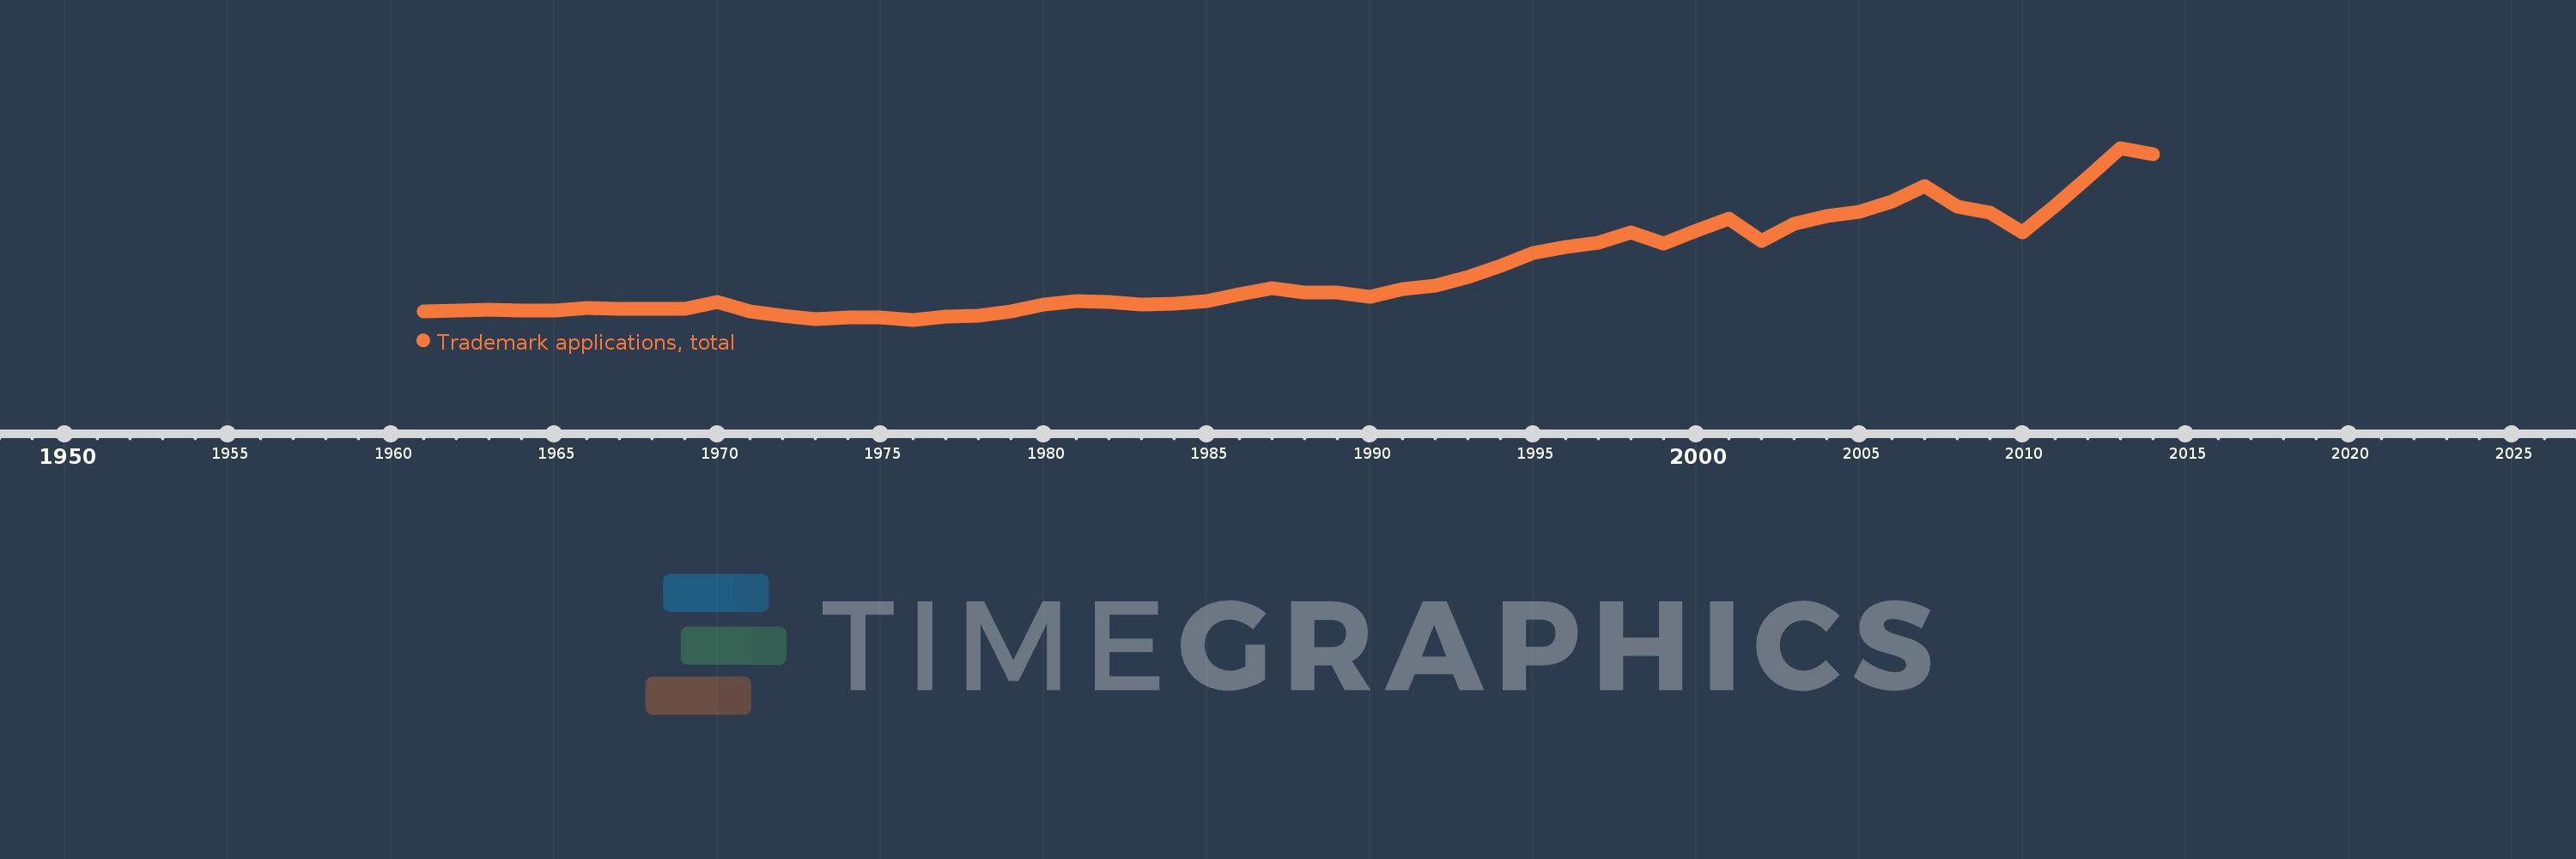
Trademark applications, total
2014,2013,2012,2011,2010,2009,2008,2007,2006,2005,2004,2003,2002,2001,2000,1999,1998,1997,1996,1995,1994,1993,1992,1991,1990,1989,1988,1987,1986,1985,1984,1983,1982,1981,1980,1979,1978,1977,1976,1975,1974,1973,1972,1971,1970,1969,1968,1967,1966,1965,1964,1963,1962,1961
This statistics in other country:
AlbaniaAlgeriaAndorraAngolaAntigua and BarbudaArab WorldArgentinaArmeniaArubaAustraliaAustriaAzerbaijanBahamas, TheBahrainBangladeshBarbadosBelarusBelgiumBelizeBhutanBoliviaBosnia and HerzegovinaBotswanaBrazilBrunei DarussalamBulgariaBurkina FasoBurundiCabo VerdeCambodiaCanadaCaribbean small statesCentral Europe and the BalticsChileChinaColombiaComorosCongo, Dem. Rep.Costa RicaCroatiaCubaCuracaoCyprusCzech RepublicDenmarkDjiboutiDominicaDominican RepublicEarly-demographic dividendEast Asia & PacificEast Asia & Pacific (excluding high income)East Asia & Pacific (IDA & IBRD countries)EcuadorEgypt, Arab Rep.El SalvadorEquatorial GuineaEstoniaEthiopiaEuro areaEurope & Central AsiaEurope & Central Asia (excluding high income)Europe & Central Asia (IDA & IBRD countries)European UnionFijiFinlandFranceGambia, TheGeorgiaGermanyGhanaGreeceGrenadaGuatemalaGuineaGuinea-BissauGuyanaHaitiHigh incomeHondurasHong Kong SAR, ChinaHungaryIBRD onlyIcelandIDA & IBRD totalIDA blendIDA onlyIDA totalIndiaIndonesiaIran, Islamic Rep.IraqIrelandIsraelItalyJamaicaJapanJordanKazakhstanKenyaKiribatiKorea, Dem. People’s Rep.Korea, Rep.KuwaitKyrgyz RepublicLao PDRLate-demographic dividendLatin America & Caribbean Latin America & Caribbean (excluding high income)Latin America & the Caribbean (IDA & IBRD countries)LatviaLeast developed countries: UN classificationLebanonLesothoLiberiaLibyaLiechtensteinLithuaniaLow & middle incomeLower middle incomeLuxembourgMacao SAR, ChinaMacedonia, FYRMadagascarMalawiMalaysiaMaldivesMaliMaltaMauritiusMexicoMiddle East & North AfricaMiddle East & North Africa (excluding high income)Middle East & North Africa (IDA & IBRD countries)Middle incomeMoldovaMonacoMongoliaMontenegroMoroccoMozambiqueMyanmarNamibiaNepalNetherlandsNew ZealandNicaraguaNigeriaNorth AmericaNorwayOECD membersOmanOther small statesPacific island small statesPakistanPanamaPapua New GuineaParaguayPeruPhilippinesPolandPortugalPost-demographic dividendQatarRomaniaRussian FederationRwandaSamoaSan MarinoSao Tome and PrincipeSaudi ArabiaSerbiaSeychellesSierra LeoneSingaporeSint Maarten (Dutch part)Slovak RepublicSloveniaSmall statesSolomon IslandsSomaliaSouth AfricaSouth AsiaSouth Asia (IDA & IBRD)SpainSri LankaSt. LuciaSt. Vincent and the GrenadinesSudanSurinameSwazilandSwedenSwitzerlandSyrian Arab RepublicTajikistanTanzaniaThailandTongaTrinidad and TobagoTunisiaTurkeyTurkmenistanTuvaluUgandaUkraineUnited Arab EmiratesUnited KingdomUnited StatesUpper middle incomeUruguayUzbekistanVenezuela, RBVietnamWorldYemen, Rep.ZambiaZimbabwe Timeline:
This timeline shows a graph from 1961 to 2014 of Sri Lanka. No data until 1960. Number of actual observations by date: 54.
Source name:
World Development Indicators
Source organization:
World Intellectual Property Organization (WIPO), World Intellectual Property Indicators and www.wipo.int/econ_stat. The International Bureau of WIPO assumes no responsibility with respect to the transformation of these data.
Categories, topics:
Science & Technology
Last updated:
apr 23, 2017
Indicators value changes by year
Maximum:
9.116K
jan 1, 2013
At the date of observation
Value
Absolute change
Change from previous value
jan 1, 1961
1.037K
+1.037K
0.0%
jan 1, 1962
1.092K
+55.0
5.3%
jan 1, 1963
1.095K
+3.0
0.27%
jan 1, 1964
1.054K
-41.0
-3.74%
jan 1, 1965
1.083K
+29.0
2.75%
jan 1, 1966
1.184K
+101.0
9.33%
jan 1, 1967
1.139K
-45.0
-3.8%
jan 1, 1968
1.178K
+39.0
3.42%
jan 1, 1969
1.15K
-28.0
-2.38%
jan 1, 1970
1.505K
+355.0
30.87%
jan 1, 1971
1.014K
-491.0
-32.62%
jan 1, 1972
806.0
-208.0
-20.51%
jan 1, 1973
631.0
-175.0
-21.71%
jan 1, 1974
752.0
+121.0
19.18%
jan 1, 1975
717.0
-35.0
-4.65%
jan 1, 1976
619.0
-98.0
-13.67%
jan 1, 1977
793.0
+174.0
28.11%
jan 1, 1978
828.0
+35.0
4.41%
jan 1, 1979
1.043K
+215.0
25.97%
jan 1, 1980
1.388K
+345.0
33.08%
jan 1, 1981
1.532K
+144.0
10.37%
jan 1, 1982
1.51K
-22.0
-1.44%
jan 1, 1983
1.382K
-128.0
-8.48%
jan 1, 1984
1.403K
+21.0
1.52%
jan 1, 1985
1.52K
+117.0
8.34%
jan 1, 1986
1.897K
+377.0
24.8%
jan 1, 1987
2.179K
+282.0
14.87%
jan 1, 1988
1.96K
-219.0
-10.05%
jan 1, 1989
1.984K
+24.0
1.22%
jan 1, 1990
1.746K
-238.0
-12.0%
jan 1, 1991
2.153K
+407.0
23.31%
jan 1, 1992
2.301K
+148.0
6.87%
jan 1, 1993
2.733K
+432.0
18.77%
jan 1, 1994
3.264K
+531.0
19.43%
jan 1, 1995
3.925K
+661.0
20.25%
jan 1, 1996
4.233K
+308.0
7.85%
jan 1, 1997
4.427K
+194.0
4.58%
jan 1, 1998
4.926K
+499.0
11.27%
jan 1, 1999
4.379K
-547.0
-11.1%
jan 1, 2000
5.02K
+641.0
14.64%
jan 1, 2001
5.638K
+618.0
12.31%
jan 1, 2002
4.523K
-1.115K
-19.78%
jan 1, 2003
5.358K
+835.0
18.46%
jan 1, 2004
5.762K
+404.0
7.54%
jan 1, 2005
5.943K
+181.0
3.14%
jan 1, 2006
6.487K
+544.0
9.15%
jan 1, 2007
7.213K
+726.0
11.19%
jan 1, 2008
6.217K
-996.0
-13.81%
jan 1, 2009
5.907K
-310.0
-4.99%
jan 1, 2010
4.927K
-980.0
-16.59%
jan 1, 2011
6.244K
+1.317K
26.73%
jan 1, 2012
7.657K
+1.413K
22.63%
jan 1, 2013
9.116K
+1.459K
19.05%
jan 1, 2014
8.825K
-291.0
-3.19%
Ranking of countries by current statistics by years


Comments: