29
/
en
AIzaSyAYiBZKx7MnpbEhh9jyipgxe19OcubqV5w
April 1, 2024
94362
Bulgaria
BGR
true
2
1
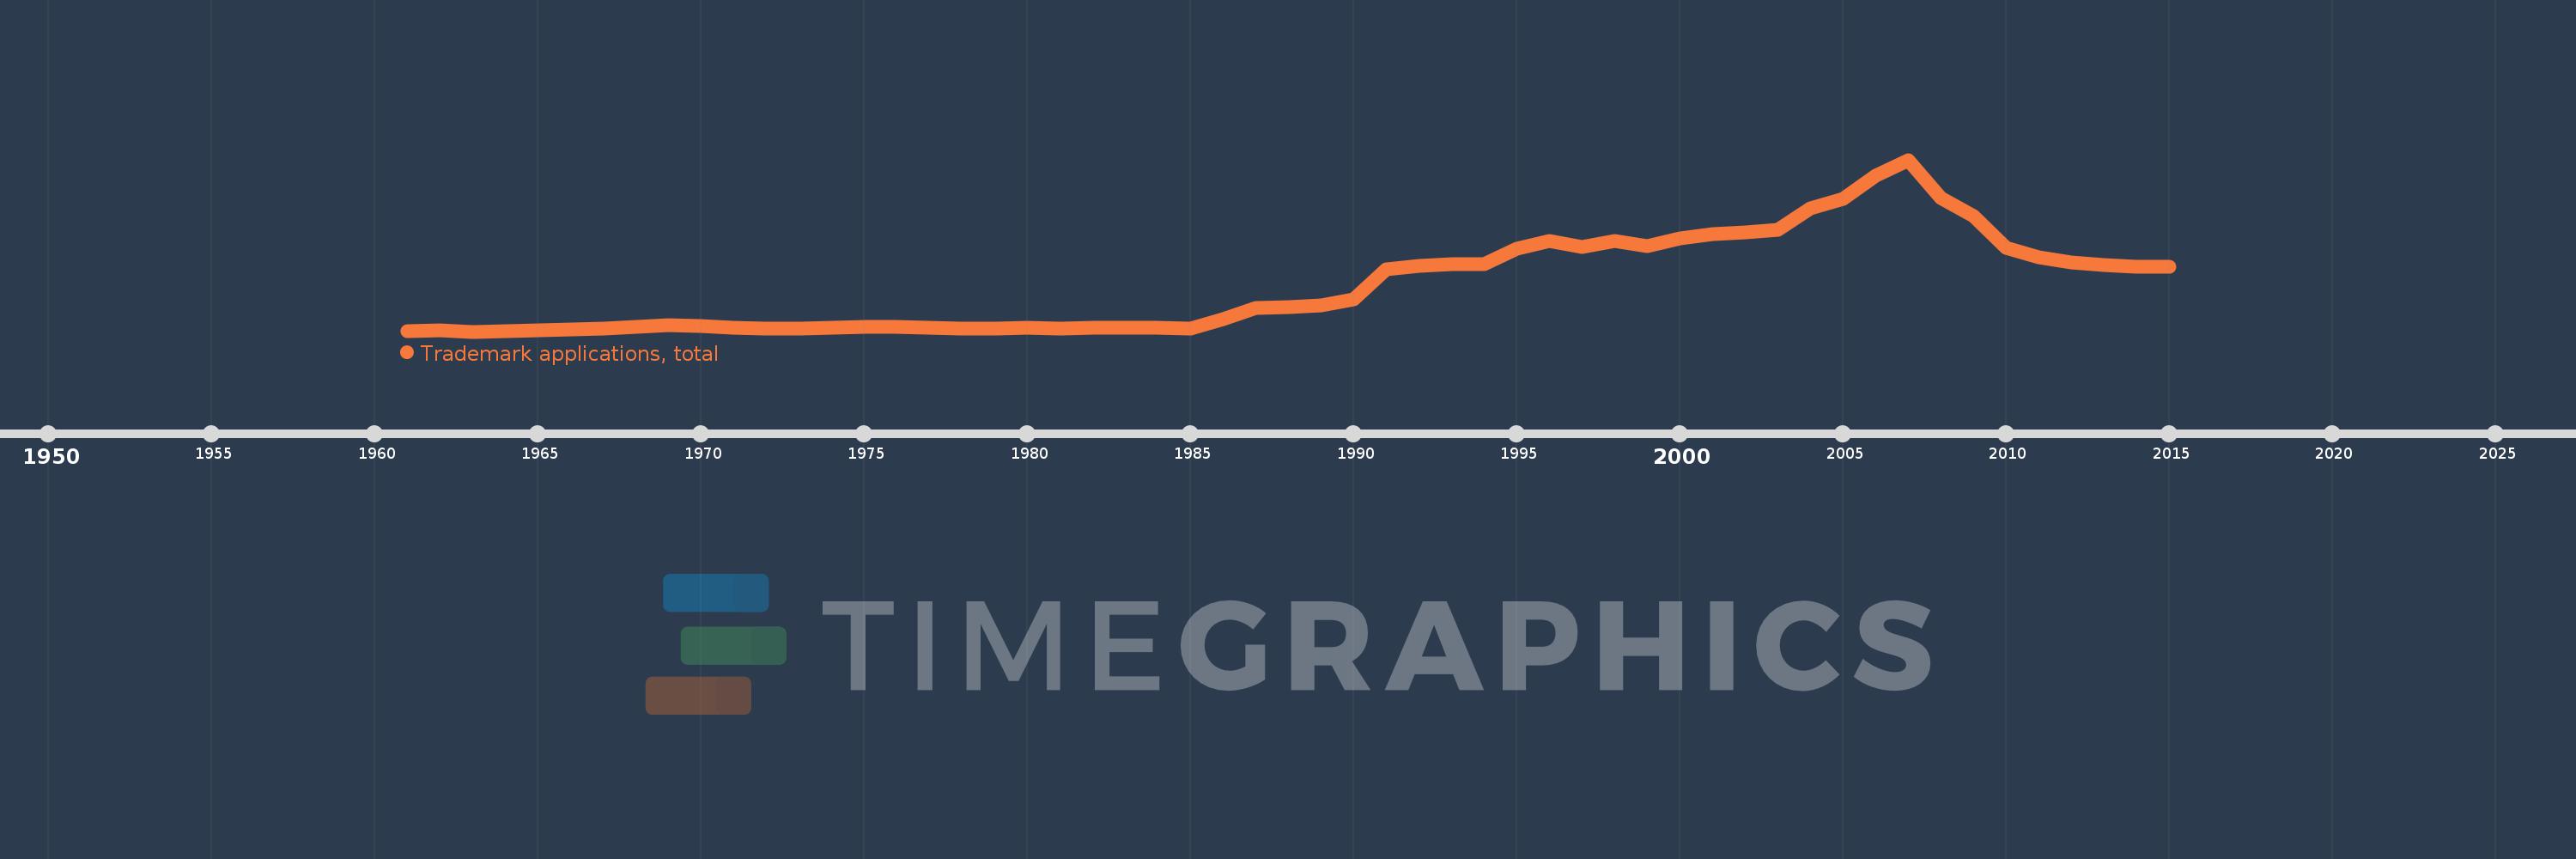
Trademark applications, total
2015,2014,2013,2012,2011,2010,2009,2008,2007,2006,2005,2004,2003,2002,2001,2000,1999,1998,1997,1996,1995,1994,1993,1992,1991,1990,1989,1988,1987,1986,1985,1984,1983,1982,1981,1980,1979,1978,1977,1976,1975,1974,1973,1972,1971,1970,1969,1968,1967,1966,1965,1964,1963,1962,1961
This statistics in other country:
AlbaniaAlgeriaAndorraAngolaAntigua and BarbudaArab WorldArgentinaArmeniaArubaAustraliaAustriaAzerbaijanBahamas, TheBahrainBangladeshBarbadosBelarusBelgiumBelizeBhutanBoliviaBosnia and HerzegovinaBotswanaBrazilBrunei DarussalamBulgariaBurkina FasoBurundiCabo VerdeCambodiaCanadaCaribbean small statesCentral Europe and the BalticsChileChinaColombiaComorosCongo, Dem. Rep.Costa RicaCroatiaCubaCuracaoCyprusCzech RepublicDenmarkDjiboutiDominicaDominican RepublicEarly-demographic dividendEast Asia & PacificEast Asia & Pacific (excluding high income)East Asia & Pacific (IDA & IBRD countries)EcuadorEgypt, Arab Rep.El SalvadorEquatorial GuineaEstoniaEthiopiaEuro areaEurope & Central AsiaEurope & Central Asia (excluding high income)Europe & Central Asia (IDA & IBRD countries)European UnionFijiFinlandFranceGambia, TheGeorgiaGermanyGhanaGreeceGrenadaGuatemalaGuineaGuinea-BissauGuyanaHaitiHigh incomeHondurasHong Kong SAR, ChinaHungaryIBRD onlyIcelandIDA & IBRD totalIDA blendIDA onlyIDA totalIndiaIndonesiaIran, Islamic Rep.IraqIrelandIsraelItalyJamaicaJapanJordanKazakhstanKenyaKiribatiKorea, Dem. People’s Rep.Korea, Rep.KuwaitKyrgyz RepublicLao PDRLate-demographic dividendLatin America & Caribbean Latin America & Caribbean (excluding high income)Latin America & the Caribbean (IDA & IBRD countries)LatviaLeast developed countries: UN classificationLebanonLesothoLiberiaLibyaLiechtensteinLithuaniaLow & middle incomeLower middle incomeLuxembourgMacao SAR, ChinaMacedonia, FYRMadagascarMalawiMalaysiaMaldivesMaliMaltaMauritiusMexicoMiddle East & North AfricaMiddle East & North Africa (excluding high income)Middle East & North Africa (IDA & IBRD countries)Middle incomeMoldovaMonacoMongoliaMontenegroMoroccoMozambiqueMyanmarNamibiaNepalNetherlandsNew ZealandNicaraguaNigeriaNorth AmericaNorwayOECD membersOmanOther small statesPacific island small statesPakistanPanamaPapua New GuineaParaguayPeruPhilippinesPolandPortugalPost-demographic dividendQatarRomaniaRussian FederationRwandaSamoaSan MarinoSao Tome and PrincipeSaudi ArabiaSerbiaSeychellesSierra LeoneSingaporeSint Maarten (Dutch part)Slovak RepublicSloveniaSmall statesSolomon IslandsSomaliaSouth AfricaSouth AsiaSouth Asia (IDA & IBRD)SpainSri LankaSt. LuciaSt. Vincent and the GrenadinesSudanSurinameSwazilandSwedenSwitzerlandSyrian Arab RepublicTajikistanTanzaniaThailandTongaTrinidad and TobagoTunisiaTurkeyTurkmenistanTuvaluUgandaUkraineUnited Arab EmiratesUnited KingdomUnited StatesUpper middle incomeUruguayUzbekistanVenezuela, RBVietnamWorldYemen, Rep.ZambiaZimbabwe Timeline:
This timeline shows a graph from 1961 to 2015 of Bulgaria. No data until 1960. Number of actual observations by date: 55.
Source name:
World Development Indicators
Source organization:
World Intellectual Property Organization (WIPO), World Intellectual Property Indicators and www.wipo.int/econ_stat. The International Bureau of WIPO assumes no responsibility with respect to the transformation of these data.
Categories, topics:
Science & Technology
Last updated:
apr 23, 2017
Indicators value changes by year
Maximum:
16.087K
jan 1, 2007
At the date of observation
Value
Absolute change
Change from previous value
jan 1, 1961
250.0
+250.0
0.0%
jan 1, 1962
318.0
+68.0
27.2%
jan 1, 1963
195.0
-123.0
-38.68%
jan 1, 1964
227.0
+32.0
16.41%
jan 1, 1965
304.0
+77.0
33.92%
jan 1, 1966
393.0
+89.0
29.28%
jan 1, 1967
502.0
+109.0
27.74%
jan 1, 1968
617.0
+115.0
22.91%
jan 1, 1969
790.0
+173.0
28.04%
jan 1, 1970
717.0
-73.0
-9.24%
jan 1, 1971
576.0
-141.0
-19.67%
jan 1, 1972
511.0
-65.0
-11.28%
jan 1, 1973
470.0
-41.0
-8.02%
jan 1, 1974
580.0
+110.0
23.4%
jan 1, 1975
624.0
+44.0
7.59%
jan 1, 1976
601.0
-23.0
-3.69%
jan 1, 1977
581.0
-20.0
-3.33%
jan 1, 1978
500.0
-81.0
-13.94%
jan 1, 1979
480.0
-20.0
-4.0%
jan 1, 1980
584.0
+104.0
21.67%
jan 1, 1981
495.0
-89.0
-15.24%
jan 1, 1982
564.0
+69.0
13.94%
jan 1, 1983
544.0
-20.0
-3.55%
jan 1, 1984
518.0
-26.0
-4.78%
jan 1, 1985
512.0
-6.0
-1.16%
jan 1, 1986
1.31K
+798.0
155.86%
jan 1, 1987
2.374K
+1.064K
81.22%
jan 1, 1988
2.455K
+81.0
3.41%
jan 1, 1989
2.647K
+192.0
7.82%
jan 1, 1990
3.178K
+531.0
20.06%
jan 1, 1991
5.979K
+2.801K
88.14%
jan 1, 1992
6.282K
+303.0
5.07%
jan 1, 1993
6.406K
+124.0
1.97%
jan 1, 1994
6.455K
+49.0
0.76%
jan 1, 1995
7.855K
+1.4K
21.69%
jan 1, 1996
8.573K
+718.0
9.14%
jan 1, 1997
8.043K
-530.0
-6.18%
jan 1, 1998
8.574K
+531.0
6.6%
jan 1, 1999
8.108K
-466.0
-5.44%
jan 1, 2000
8.782K
+674.0
8.31%
jan 1, 2001
9.218K
+436.0
4.96%
jan 1, 2002
9.402K
+184.0
2.0%
jan 1, 2003
9.619K
+217.0
2.31%
jan 1, 2004
11.61K
+1.991K
20.7%
jan 1, 2005
12.473K
+863.0
7.43%
jan 1, 2006
14.618K
+2.145K
17.2%
jan 1, 2007
16.087K
+1.469K
10.05%
jan 1, 2008
12.539K
-3.548K
-22.06%
jan 1, 2009
10.853K
-1.686K
-13.45%
jan 1, 2010
7.904K
-2.949K
-27.17%
jan 1, 2011
7.046K
-858.0
-10.86%
jan 1, 2012
6.626K
-420.0
-5.96%
jan 1, 2013
6.329K
-297.0
-4.48%
jan 1, 2014
6.177K
-152.0
-2.4%
jan 1, 2015
6.195K
+18.0
0.29%
Ranking of countries by current statistics by years


Comments: