29
/
en
AIzaSyAYiBZKx7MnpbEhh9jyipgxe19OcubqV5w
April 1, 2024
96892
Burundi
BDI
true
2
1
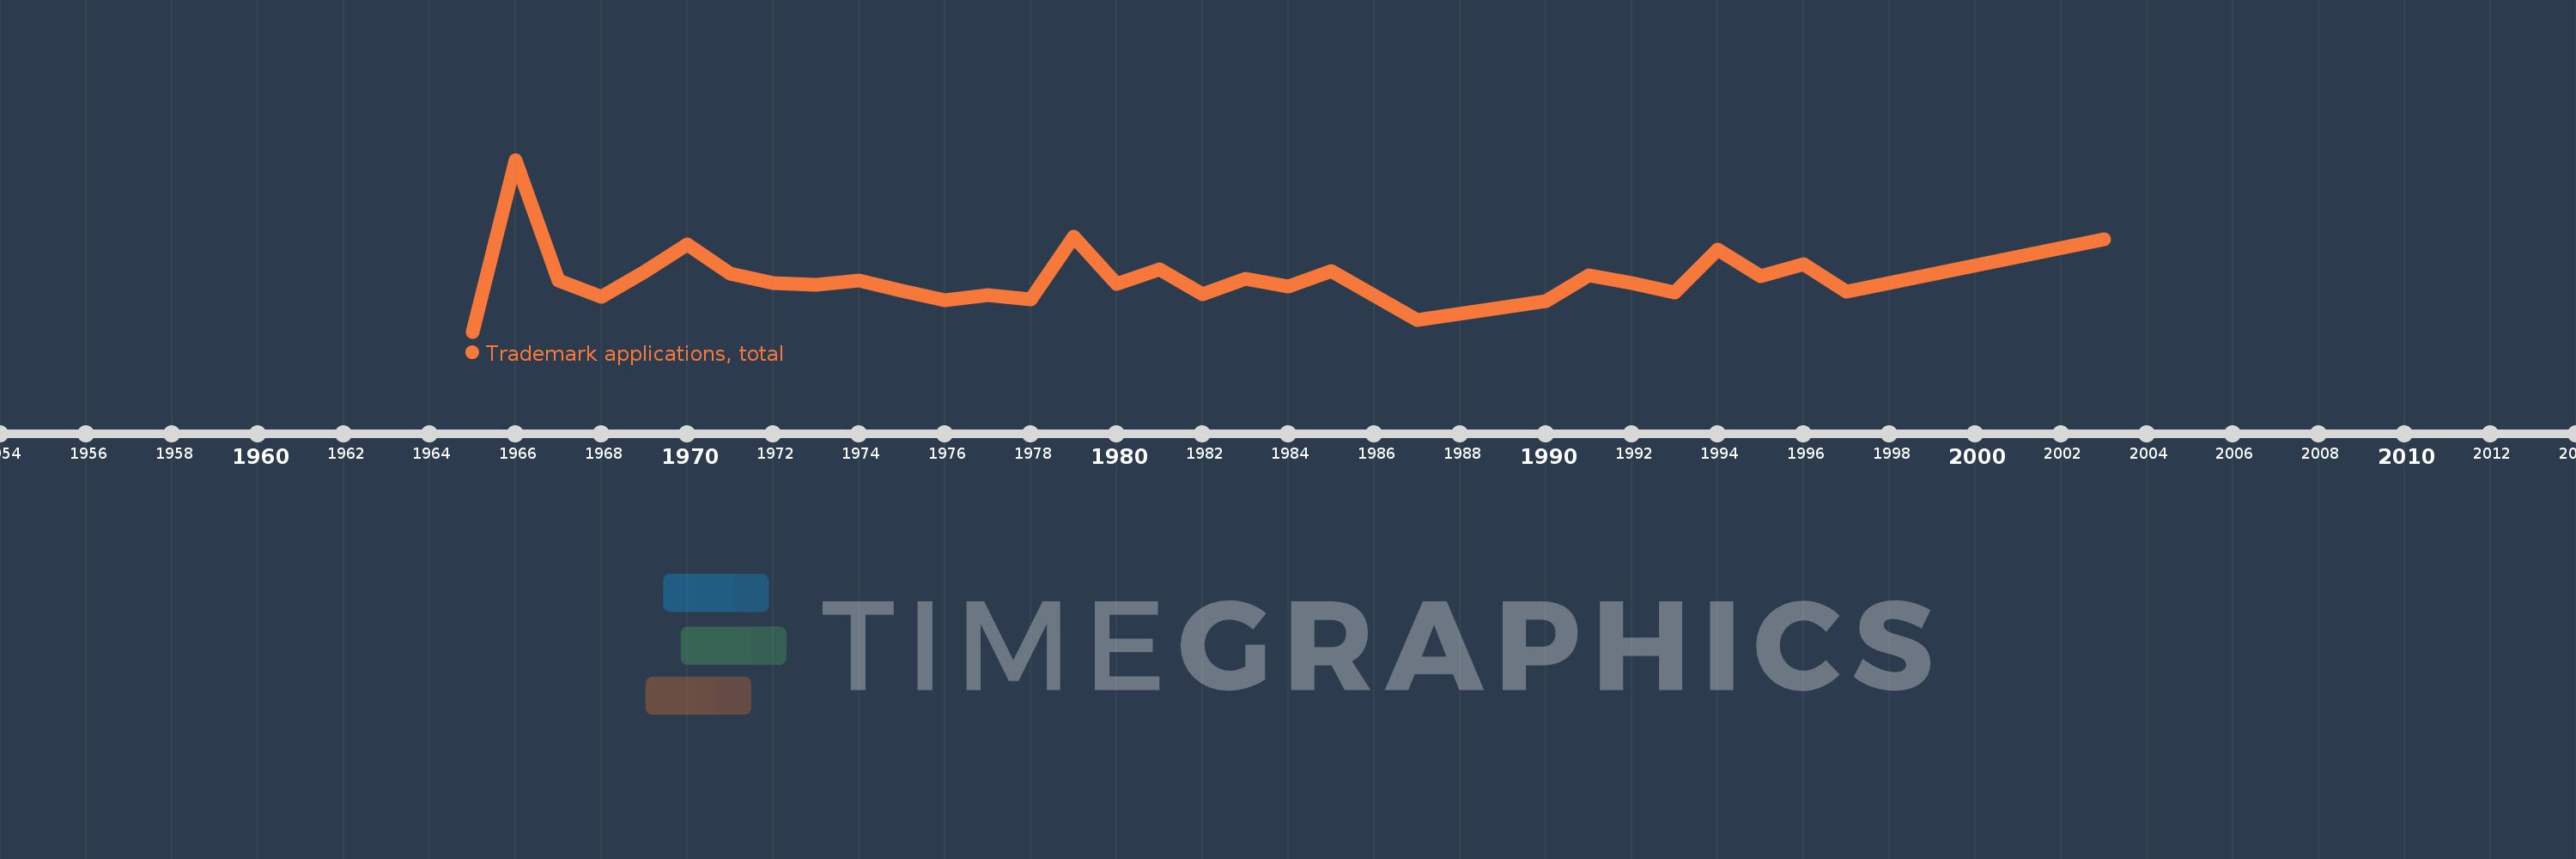
Trademark applications, total
2003,1997,1996,1995,1994,1993,1992,1991,1990,1987,1985,1984,1983,1982,1981,1980,1979,1978,1977,1976,1975,1974,1973,1972,1971,1970,1969,1968,1967,1966,1965
This statistics in other country:
AlbaniaAlgeriaAndorraAngolaAntigua and BarbudaArab WorldArgentinaArmeniaArubaAustraliaAustriaAzerbaijanBahamas, TheBahrainBangladeshBarbadosBelarusBelgiumBelizeBhutanBoliviaBosnia and HerzegovinaBotswanaBrazilBrunei DarussalamBulgariaBurkina FasoBurundiCabo VerdeCambodiaCanadaCaribbean small statesCentral Europe and the BalticsChileChinaColombiaComorosCongo, Dem. Rep.Costa RicaCroatiaCubaCuracaoCyprusCzech RepublicDenmarkDjiboutiDominicaDominican RepublicEarly-demographic dividendEast Asia & PacificEast Asia & Pacific (excluding high income)East Asia & Pacific (IDA & IBRD countries)EcuadorEgypt, Arab Rep.El SalvadorEquatorial GuineaEstoniaEthiopiaEuro areaEurope & Central AsiaEurope & Central Asia (excluding high income)Europe & Central Asia (IDA & IBRD countries)European UnionFijiFinlandFranceGambia, TheGeorgiaGermanyGhanaGreeceGrenadaGuatemalaGuineaGuinea-BissauGuyanaHaitiHigh incomeHondurasHong Kong SAR, ChinaHungaryIBRD onlyIcelandIDA & IBRD totalIDA blendIDA onlyIDA totalIndiaIndonesiaIran, Islamic Rep.IraqIrelandIsraelItalyJamaicaJapanJordanKazakhstanKenyaKiribatiKorea, Dem. People’s Rep.Korea, Rep.KuwaitKyrgyz RepublicLao PDRLate-demographic dividendLatin America & Caribbean Latin America & Caribbean (excluding high income)Latin America & the Caribbean (IDA & IBRD countries)LatviaLeast developed countries: UN classificationLebanonLesothoLiberiaLibyaLiechtensteinLithuaniaLow & middle incomeLower middle incomeLuxembourgMacao SAR, ChinaMacedonia, FYRMadagascarMalawiMalaysiaMaldivesMaliMaltaMauritiusMexicoMiddle East & North AfricaMiddle East & North Africa (excluding high income)Middle East & North Africa (IDA & IBRD countries)Middle incomeMoldovaMonacoMongoliaMontenegroMoroccoMozambiqueMyanmarNamibiaNepalNetherlandsNew ZealandNicaraguaNigeriaNorth AmericaNorwayOECD membersOmanOther small statesPacific island small statesPakistanPanamaPapua New GuineaParaguayPeruPhilippinesPolandPortugalPost-demographic dividendQatarRomaniaRussian FederationRwandaSamoaSan MarinoSao Tome and PrincipeSaudi ArabiaSerbiaSeychellesSierra LeoneSingaporeSint Maarten (Dutch part)Slovak RepublicSloveniaSmall statesSolomon IslandsSomaliaSouth AfricaSouth AsiaSouth Asia (IDA & IBRD)SpainSri LankaSt. LuciaSt. Vincent and the GrenadinesSudanSurinameSwazilandSwedenSwitzerlandSyrian Arab RepublicTajikistanTanzaniaThailandTongaTrinidad and TobagoTunisiaTurkeyTurkmenistanTuvaluUgandaUkraineUnited Arab EmiratesUnited KingdomUnited StatesUpper middle incomeUruguayUzbekistanVenezuela, RBVietnamWorldYemen, Rep.ZambiaZimbabwe Timeline:
This timeline shows a graph from 1965 to 2003 of Burundi. No data until 1964. Number of actual observations by date: 31.
Source name:
World Development Indicators
Source organization:
World Intellectual Property Organization (WIPO), World Intellectual Property Indicators and www.wipo.int/econ_stat. The International Bureau of WIPO assumes no responsibility with respect to the transformation of these data.
Categories, topics:
Science & Technology
Last updated:
apr 23, 2017
Indicators value changes by year
At the date of observation
Value
Absolute change
Change from previous value
jan 1, 1965
22.0
+22.0
0.0%
jan 1, 1966
264.0
+242.0
1.1K%
jan 1, 1967
94.0
-170.0
-64.39%
jan 1, 1968
71.0
-23.0
-24.47%
jan 1, 1969
106.0
+35.0
49.3%
jan 1, 1970
145.0
+39.0
36.79%
jan 1, 1971
104.0
-41.0
-28.28%
jan 1, 1972
90.0
-14.0
-13.46%
jan 1, 1973
88.0
-2.0
-2.22%
jan 1, 1974
94.0
+6.0
6.82%
jan 1, 1975
80.0
-14.0
-14.89%
jan 1, 1976
66.0
-14.0
-17.5%
jan 1, 1977
73.0
+7.0
10.61%
jan 1, 1978
67.0
-6.0
-8.22%
jan 1, 1979
156.0
+89.0
132.84%
jan 1, 1980
89.0
-67.0
-42.95%
jan 1, 1981
110.0
+21.0
23.6%
jan 1, 1982
75.0
-35.0
-31.82%
jan 1, 1983
97.0
+22.0
29.33%
jan 1, 1984
86.0
-11.0
-11.34%
jan 1, 1985
107.0
+21.0
24.42%
jan 1, 1987
38.0
-69.0
-64.49%
jan 1, 1990
65.0
+27.0
71.05%
jan 1, 1991
101.0
+36.0
55.38%
jan 1, 1992
90.0
-11.0
-10.89%
jan 1, 1993
77.0
-13.0
-14.44%
jan 1, 1994
138.0
+61.0
79.22%
jan 1, 1995
100.0
-38.0
-27.54%
jan 1, 1996
117.0
+17.0
17.0%
jan 1, 1997
78.0
-39.0
-33.33%
jan 1, 2003
152.0
+74.0
94.87%
Ranking of countries by current statistics by years


Comments: