29
/
en
AIzaSyAYiBZKx7MnpbEhh9jyipgxe19OcubqV5w
April 1, 2024
141225
Ghana
GHA
true
2
1
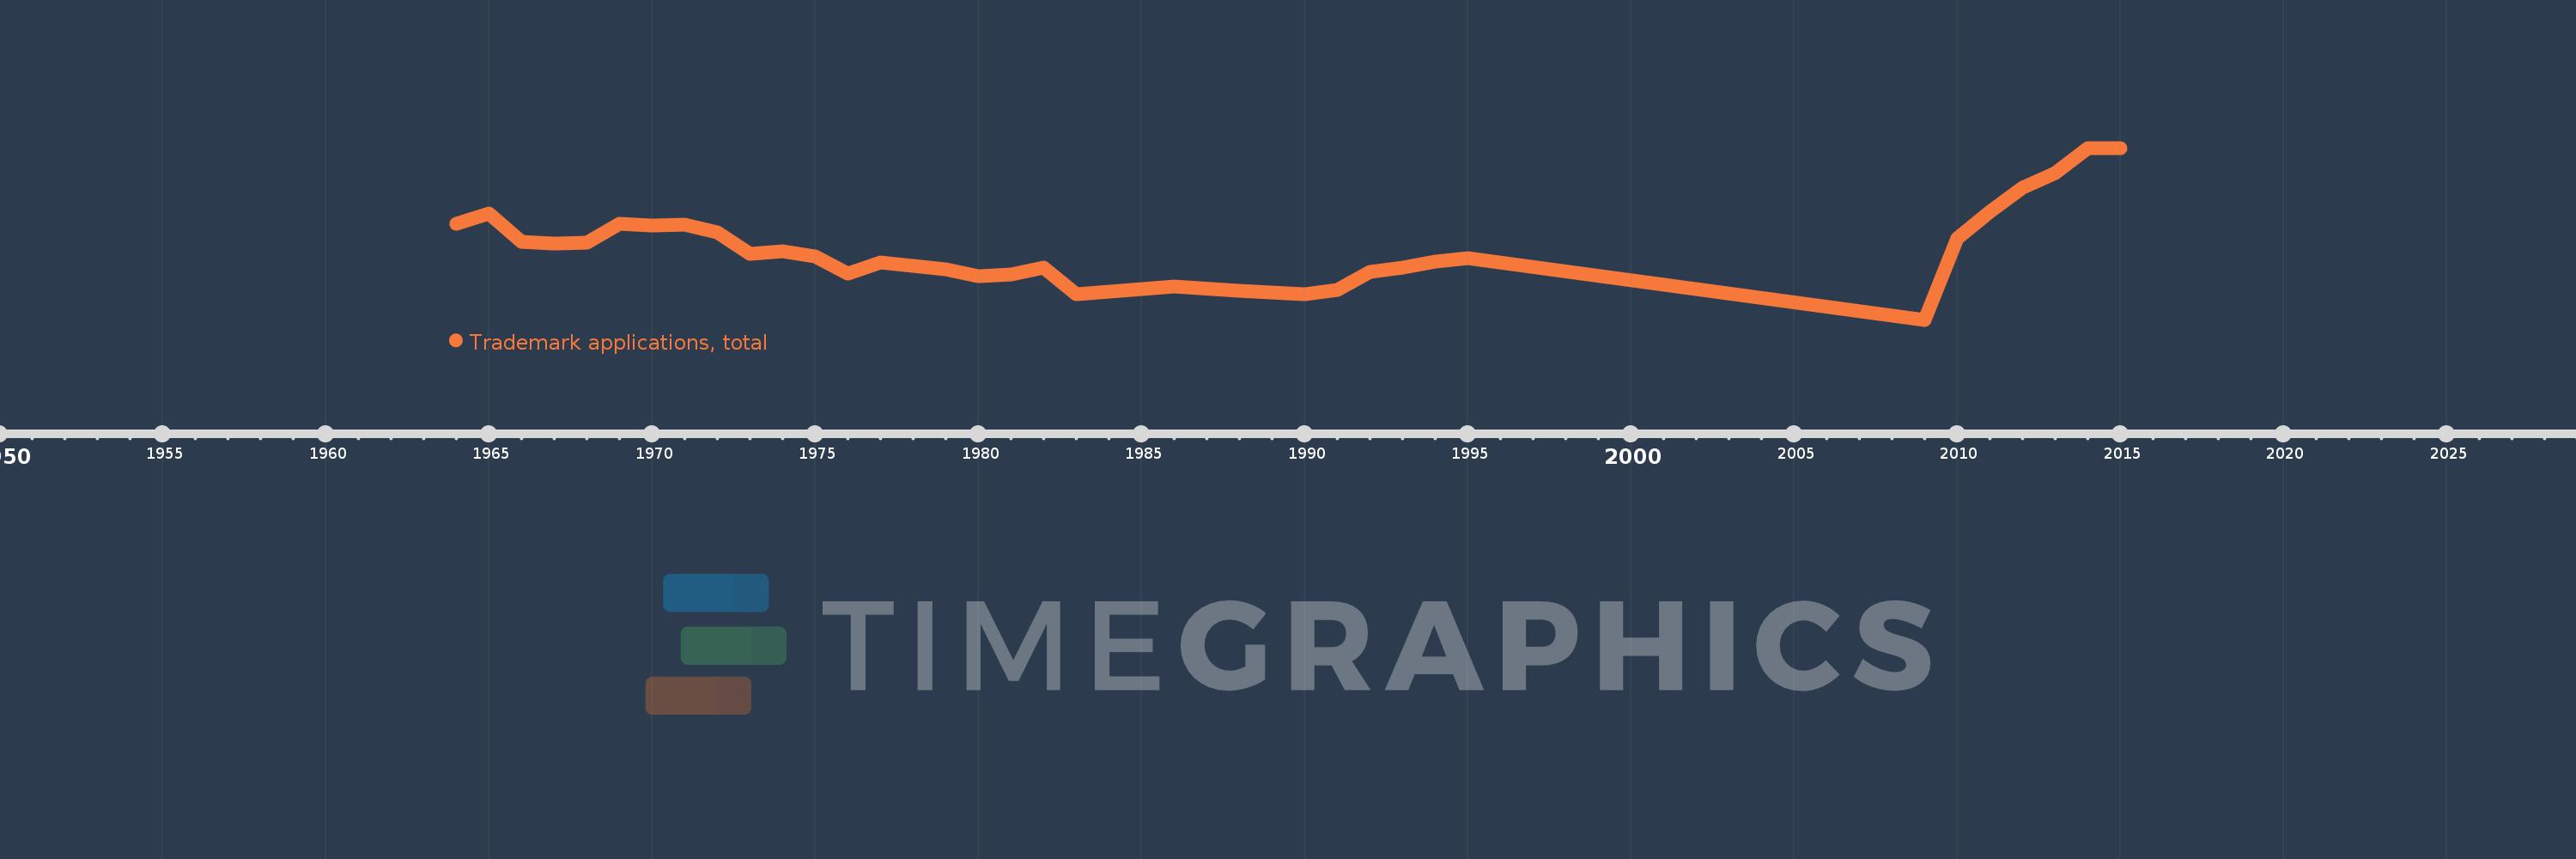
Trademark applications, total
2015,2014,2013,2012,2011,2010,2009,1995,1994,1993,1992,1991,1990,1988,1986,1983,1982,1981,1980,1979,1978,1977,1976,1975,1974,1973,1972,1971,1970,1969,1968,1967,1966,1965,1964
This statistics in other country:
AlbaniaAlgeriaAndorraAngolaAntigua and BarbudaArab WorldArgentinaArmeniaArubaAustraliaAustriaAzerbaijanBahamas, TheBahrainBangladeshBarbadosBelarusBelgiumBelizeBhutanBoliviaBosnia and HerzegovinaBotswanaBrazilBrunei DarussalamBulgariaBurkina FasoBurundiCabo VerdeCambodiaCanadaCaribbean small statesCentral Europe and the BalticsChileChinaColombiaComorosCongo, Dem. Rep.Costa RicaCroatiaCubaCuracaoCyprusCzech RepublicDenmarkDjiboutiDominicaDominican RepublicEarly-demographic dividendEast Asia & PacificEast Asia & Pacific (excluding high income)East Asia & Pacific (IDA & IBRD countries)EcuadorEgypt, Arab Rep.El SalvadorEquatorial GuineaEstoniaEthiopiaEuro areaEurope & Central AsiaEurope & Central Asia (excluding high income)Europe & Central Asia (IDA & IBRD countries)European UnionFijiFinlandFranceGambia, TheGeorgiaGermanyGhanaGreeceGrenadaGuatemalaGuineaGuinea-BissauGuyanaHaitiHigh incomeHondurasHong Kong SAR, ChinaHungaryIBRD onlyIcelandIDA & IBRD totalIDA blendIDA onlyIDA totalIndiaIndonesiaIran, Islamic Rep.IraqIrelandIsraelItalyJamaicaJapanJordanKazakhstanKenyaKiribatiKorea, Dem. People’s Rep.Korea, Rep.KuwaitKyrgyz RepublicLao PDRLate-demographic dividendLatin America & Caribbean Latin America & Caribbean (excluding high income)Latin America & the Caribbean (IDA & IBRD countries)LatviaLeast developed countries: UN classificationLebanonLesothoLiberiaLibyaLiechtensteinLithuaniaLow & middle incomeLower middle incomeLuxembourgMacao SAR, ChinaMacedonia, FYRMadagascarMalawiMalaysiaMaldivesMaliMaltaMauritiusMexicoMiddle East & North AfricaMiddle East & North Africa (excluding high income)Middle East & North Africa (IDA & IBRD countries)Middle incomeMoldovaMonacoMongoliaMontenegroMoroccoMozambiqueMyanmarNamibiaNepalNetherlandsNew ZealandNicaraguaNigeriaNorth AmericaNorwayOECD membersOmanOther small statesPacific island small statesPakistanPanamaPapua New GuineaParaguayPeruPhilippinesPolandPortugalPost-demographic dividendQatarRomaniaRussian FederationRwandaSamoaSan MarinoSao Tome and PrincipeSaudi ArabiaSerbiaSeychellesSierra LeoneSingaporeSint Maarten (Dutch part)Slovak RepublicSloveniaSmall statesSolomon IslandsSomaliaSouth AfricaSouth AsiaSouth Asia (IDA & IBRD)SpainSri LankaSt. LuciaSt. Vincent and the GrenadinesSudanSurinameSwazilandSwedenSwitzerlandSyrian Arab RepublicTajikistanTanzaniaThailandTongaTrinidad and TobagoTunisiaTurkeyTurkmenistanTuvaluUgandaUkraineUnited Arab EmiratesUnited KingdomUnited StatesUpper middle incomeUruguayUzbekistanVenezuela, RBVietnamWorldYemen, Rep.ZambiaZimbabwe Timeline:
This timeline shows a graph from 1964 to 2015 of Ghana. No data until 1963. Number of actual observations by date: 35.
Source name:
World Development Indicators
Source organization:
World Intellectual Property Organization (WIPO), World Intellectual Property Indicators and www.wipo.int/econ_stat. The International Bureau of WIPO assumes no responsibility with respect to the transformation of these data.
Categories, topics:
Science & Technology
Last updated:
apr 23, 2017
Indicators value changes by year
Maximum:
1.366K
jan 1, 2015
At the date of observation
Value
Absolute change
Change from previous value
jan 1, 1964
790.0
+790.0
0.0%
jan 1, 1965
870.0
+80.0
10.13%
jan 1, 1966
652.0
-218.0
-25.06%
jan 1, 1967
639.0
-13.0
-1.99%
jan 1, 1968
647.0
+8.0
1.25%
jan 1, 1969
790.0
+143.0
22.1%
jan 1, 1970
774.0
-16.0
-2.03%
jan 1, 1971
786.0
+12.0
1.55%
jan 1, 1972
725.0
-61.0
-7.76%
jan 1, 1973
562.0
-163.0
-22.48%
jan 1, 1974
579.0
+17.0
3.02%
jan 1, 1975
544.0
-35.0
-6.04%
jan 1, 1976
409.0
-135.0
-24.82%
jan 1, 1977
496.0
+87.0
21.27%
jan 1, 1978
467.0
-29.0
-5.85%
jan 1, 1979
445.0
-22.0
-4.71%
jan 1, 1980
390.0
-55.0
-12.36%
jan 1, 1981
408.0
+18.0
4.62%
jan 1, 1982
455.0
+47.0
11.52%
jan 1, 1983
254.0
-201.0
-44.18%
jan 1, 1986
312.0
+58.0
22.83%
jan 1, 1988
284.0
-28.0
-8.97%
jan 1, 1990
254.0
-30.0
-10.56%
jan 1, 1991
289.0
+35.0
13.78%
jan 1, 1992
424.0
+135.0
46.71%
jan 1, 1993
457.0
+33.0
7.78%
jan 1, 1994
505.0
+48.0
10.5%
jan 1, 1995
529.0
+24.0
4.75%
jan 1, 2009
61.0
-468.0
-88.47%
jan 1, 2010
677.0
+616.0
1.01K%
jan 1, 2011
882.0
+205.0
30.28%
jan 1, 2012
1.067K
+185.0
20.98%
jan 1, 2013
1.177K
+110.0
10.31%
jan 1, 2014
1.365K
+188.0
15.97%
jan 1, 2015
1.366K
+1.0
0.07%
Ranking of countries by current statistics by years


Comments: