29
/
en
AIzaSyAYiBZKx7MnpbEhh9jyipgxe19OcubqV5w
April 1, 2024
267496
Trinidad and Tobago
TTO
true
2
1
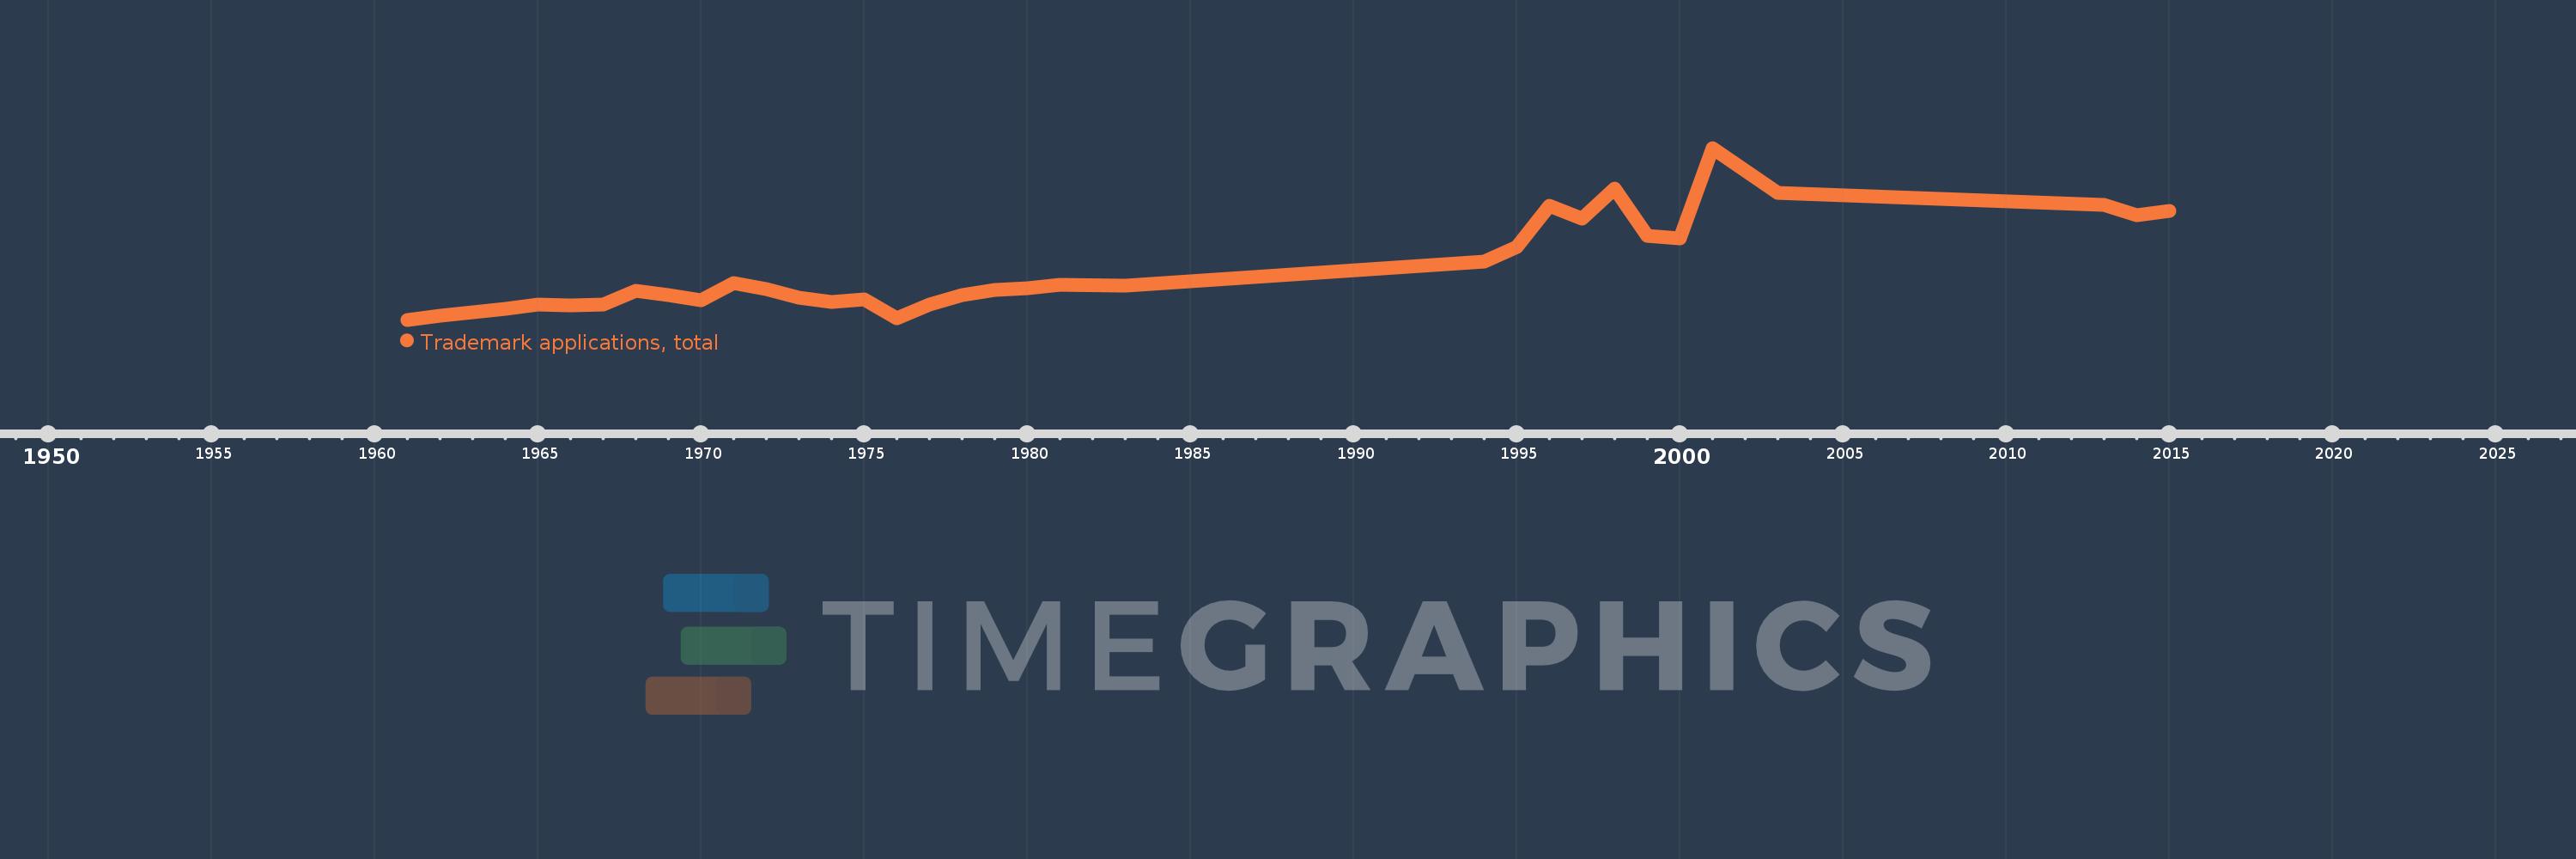
Trademark applications, total
2015,2014,2013,2003,2001,2000,1999,1998,1997,1996,1995,1994,1983,1981,1980,1979,1978,1977,1976,1975,1974,1973,1972,1971,1970,1969,1968,1967,1966,1965,1964,1962,1961
This statistics in other country:
AlbaniaAlgeriaAndorraAngolaAntigua and BarbudaArab WorldArgentinaArmeniaArubaAustraliaAustriaAzerbaijanBahamas, TheBahrainBangladeshBarbadosBelarusBelgiumBelizeBhutanBoliviaBosnia and HerzegovinaBotswanaBrazilBrunei DarussalamBulgariaBurkina FasoBurundiCabo VerdeCambodiaCanadaCaribbean small statesCentral Europe and the BalticsChileChinaColombiaComorosCongo, Dem. Rep.Costa RicaCroatiaCubaCuracaoCyprusCzech RepublicDenmarkDjiboutiDominicaDominican RepublicEarly-demographic dividendEast Asia & PacificEast Asia & Pacific (excluding high income)East Asia & Pacific (IDA & IBRD countries)EcuadorEgypt, Arab Rep.El SalvadorEquatorial GuineaEstoniaEthiopiaEuro areaEurope & Central AsiaEurope & Central Asia (excluding high income)Europe & Central Asia (IDA & IBRD countries)European UnionFijiFinlandFranceGambia, TheGeorgiaGermanyGhanaGreeceGrenadaGuatemalaGuineaGuinea-BissauGuyanaHaitiHigh incomeHondurasHong Kong SAR, ChinaHungaryIBRD onlyIcelandIDA & IBRD totalIDA blendIDA onlyIDA totalIndiaIndonesiaIran, Islamic Rep.IraqIrelandIsraelItalyJamaicaJapanJordanKazakhstanKenyaKiribatiKorea, Dem. People’s Rep.Korea, Rep.KuwaitKyrgyz RepublicLao PDRLate-demographic dividendLatin America & Caribbean Latin America & Caribbean (excluding high income)Latin America & the Caribbean (IDA & IBRD countries)LatviaLeast developed countries: UN classificationLebanonLesothoLiberiaLibyaLiechtensteinLithuaniaLow & middle incomeLower middle incomeLuxembourgMacao SAR, ChinaMacedonia, FYRMadagascarMalawiMalaysiaMaldivesMaliMaltaMauritiusMexicoMiddle East & North AfricaMiddle East & North Africa (excluding high income)Middle East & North Africa (IDA & IBRD countries)Middle incomeMoldovaMonacoMongoliaMontenegroMoroccoMozambiqueMyanmarNamibiaNepalNetherlandsNew ZealandNicaraguaNigeriaNorth AmericaNorwayOECD membersOmanOther small statesPacific island small statesPakistanPanamaPapua New GuineaParaguayPeruPhilippinesPolandPortugalPost-demographic dividendQatarRomaniaRussian FederationRwandaSamoaSan MarinoSao Tome and PrincipeSaudi ArabiaSerbiaSeychellesSierra LeoneSingaporeSint Maarten (Dutch part)Slovak RepublicSloveniaSmall statesSolomon IslandsSomaliaSouth AfricaSouth AsiaSouth Asia (IDA & IBRD)SpainSri LankaSt. LuciaSt. Vincent and the GrenadinesSudanSurinameSwazilandSwedenSwitzerlandSyrian Arab RepublicTajikistanTanzaniaThailandTongaTrinidad and TobagoTunisiaTurkeyTurkmenistanTuvaluUgandaUkraineUnited Arab EmiratesUnited KingdomUnited StatesUpper middle incomeUruguayUzbekistanVenezuela, RBVietnamWorldYemen, Rep.ZambiaZimbabwe Timeline:
This timeline shows a graph from 1961 to 2015 of Trinidad and Tobago. No data until 1960. Number of actual observations by date: 33.
Source name:
World Development Indicators
Source organization:
World Intellectual Property Organization (WIPO), World Intellectual Property Indicators and www.wipo.int/econ_stat. The International Bureau of WIPO assumes no responsibility with respect to the transformation of these data.
Categories, topics:
Science & Technology
Last updated:
apr 23, 2017
Indicators value changes by year
At the date of observation
Value
Absolute change
Change from previous value
jan 1, 1961
357.0
+357.0
0.0%
jan 1, 1962
401.0
+44.0
12.32%
jan 1, 1964
467.0
+66.0
16.46%
jan 1, 1965
514.0
+47.0
10.06%
jan 1, 1966
500.0
-14.0
-2.72%
jan 1, 1967
514.0
+14.0
2.8%
jan 1, 1968
652.0
+138.0
26.85%
jan 1, 1969
614.0
-38.0
-5.83%
jan 1, 1970
561.0
-53.0
-8.63%
jan 1, 1971
732.0
+171.0
30.48%
jan 1, 1972
671.0
-61.0
-8.33%
jan 1, 1973
582.0
-89.0
-13.26%
jan 1, 1974
536.0
-46.0
-7.9%
jan 1, 1975
567.0
+31.0
5.78%
jan 1, 1976
376.0
-191.0
-33.69%
jan 1, 1977
509.0
+133.0
35.37%
jan 1, 1978
612.0
+103.0
20.24%
jan 1, 1979
662.0
+50.0
8.17%
jan 1, 1980
681.0
+19.0
2.87%
jan 1, 1981
713.0
+32.0
4.7%
jan 1, 1983
704.0
-9.0
-1.26%
jan 1, 1994
957.0
+253.0
35.94%
jan 1, 1995
1.107K
+150.0
15.67%
jan 1, 1996
1.525K
+418.0
37.76%
jan 1, 1997
1.395K
-130.0
-8.52%
jan 1, 1998
1.699K
+304.0
21.79%
jan 1, 1999
1.214K
-485.0
-28.55%
jan 1, 2000
1.196K
-18.0
-1.48%
jan 1, 2001
2.12K
+924.0
77.26%
jan 1, 2003
1.657K
-463.0
-21.84%
jan 1, 2013
1.538K
-119.0
-7.18%
jan 1, 2014
1.428K
-110.0
-7.15%
jan 1, 2015
1.475K
+47.0
3.29%
Ranking of countries by current statistics by years


Comments: