29
/
en
AIzaSyAYiBZKx7MnpbEhh9jyipgxe19OcubqV5w
April 1, 2024
202402
Morocco
MAR
true
2
1
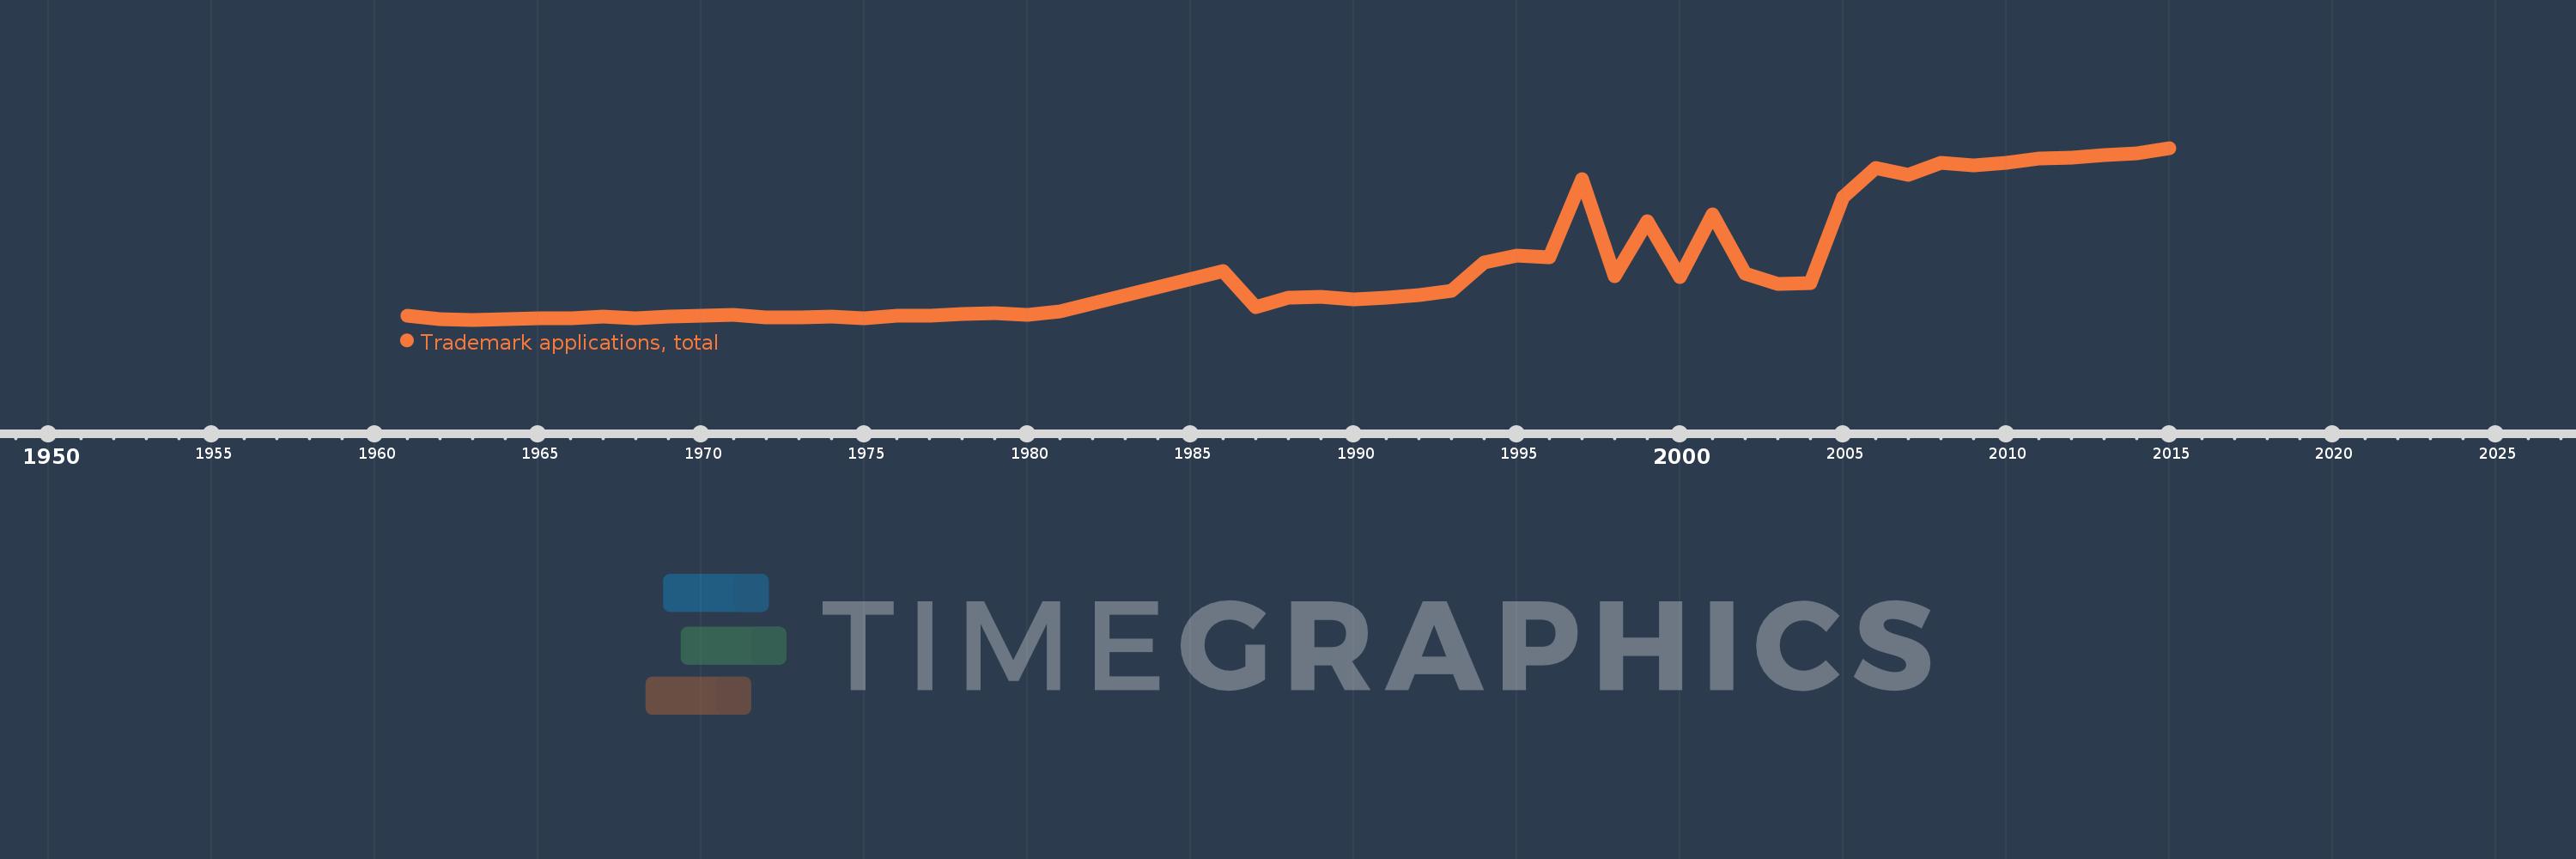
Trademark applications, total
2015,2014,2013,2012,2011,2010,2009,2008,2007,2006,2005,2004,2003,2002,2001,2000,1999,1998,1997,1996,1995,1994,1993,1992,1991,1990,1989,1988,1987,1986,1981,1980,1979,1978,1977,1976,1975,1974,1973,1972,1971,1970,1969,1968,1967,1966,1965,1964,1963,1962,1961
This statistics in other country:
AlbaniaAlgeriaAndorraAngolaAntigua and BarbudaArab WorldArgentinaArmeniaArubaAustraliaAustriaAzerbaijanBahamas, TheBahrainBangladeshBarbadosBelarusBelgiumBelizeBhutanBoliviaBosnia and HerzegovinaBotswanaBrazilBrunei DarussalamBulgariaBurkina FasoBurundiCabo VerdeCambodiaCanadaCaribbean small statesCentral Europe and the BalticsChileChinaColombiaComorosCongo, Dem. Rep.Costa RicaCroatiaCubaCuracaoCyprusCzech RepublicDenmarkDjiboutiDominicaDominican RepublicEarly-demographic dividendEast Asia & PacificEast Asia & Pacific (excluding high income)East Asia & Pacific (IDA & IBRD countries)EcuadorEgypt, Arab Rep.El SalvadorEquatorial GuineaEstoniaEthiopiaEuro areaEurope & Central AsiaEurope & Central Asia (excluding high income)Europe & Central Asia (IDA & IBRD countries)European UnionFijiFinlandFranceGambia, TheGeorgiaGermanyGhanaGreeceGrenadaGuatemalaGuineaGuinea-BissauGuyanaHaitiHigh incomeHondurasHong Kong SAR, ChinaHungaryIBRD onlyIcelandIDA & IBRD totalIDA blendIDA onlyIDA totalIndiaIndonesiaIran, Islamic Rep.IraqIrelandIsraelItalyJamaicaJapanJordanKazakhstanKenyaKiribatiKorea, Dem. People’s Rep.Korea, Rep.KuwaitKyrgyz RepublicLao PDRLate-demographic dividendLatin America & Caribbean Latin America & Caribbean (excluding high income)Latin America & the Caribbean (IDA & IBRD countries)LatviaLeast developed countries: UN classificationLebanonLesothoLiberiaLibyaLiechtensteinLithuaniaLow & middle incomeLower middle incomeLuxembourgMacao SAR, ChinaMacedonia, FYRMadagascarMalawiMalaysiaMaldivesMaliMaltaMauritiusMexicoMiddle East & North AfricaMiddle East & North Africa (excluding high income)Middle East & North Africa (IDA & IBRD countries)Middle incomeMoldovaMonacoMongoliaMontenegroMoroccoMozambiqueMyanmarNamibiaNepalNetherlandsNew ZealandNicaraguaNigeriaNorth AmericaNorwayOECD membersOmanOther small statesPacific island small statesPakistanPanamaPapua New GuineaParaguayPeruPhilippinesPolandPortugalPost-demographic dividendQatarRomaniaRussian FederationRwandaSamoaSan MarinoSao Tome and PrincipeSaudi ArabiaSerbiaSeychellesSierra LeoneSingaporeSint Maarten (Dutch part)Slovak RepublicSloveniaSmall statesSolomon IslandsSomaliaSouth AfricaSouth AsiaSouth Asia (IDA & IBRD)SpainSri LankaSt. LuciaSt. Vincent and the GrenadinesSudanSurinameSwazilandSwedenSwitzerlandSyrian Arab RepublicTajikistanTanzaniaThailandTongaTrinidad and TobagoTunisiaTurkeyTurkmenistanTuvaluUgandaUkraineUnited Arab EmiratesUnited KingdomUnited StatesUpper middle incomeUruguayUzbekistanVenezuela, RBVietnamWorldYemen, Rep.ZambiaZimbabwe Timeline:
This timeline shows a graph from 1961 to 2015 of Morocco. No data until 1960. Number of actual observations by date: 51.
Source name:
World Development Indicators
Source organization:
World Intellectual Property Organization (WIPO), World Intellectual Property Indicators and www.wipo.int/econ_stat. The International Bureau of WIPO assumes no responsibility with respect to the transformation of these data.
Categories, topics:
Science & Technology
Last updated:
apr 23, 2017
Indicators value changes by year
Maximum:
11.708K
jan 1, 2015
At the date of observation
Value
Absolute change
Change from previous value
jan 1, 1961
735.0
+735.0
0.0%
jan 1, 1962
536.0
-199.0
-27.07%
jan 1, 1963
483.0
-53.0
-9.89%
jan 1, 1964
549.0
+66.0
13.66%
jan 1, 1965
585.0
+36.0
6.56%
jan 1, 1966
554.0
-31.0
-5.3%
jan 1, 1967
671.0
+117.0
21.12%
jan 1, 1968
604.0
-67.0
-9.99%
jan 1, 1969
666.0
+62.0
10.26%
jan 1, 1970
725.0
+59.0
8.86%
jan 1, 1971
813.0
+88.0
12.14%
jan 1, 1972
639.0
-174.0
-21.4%
jan 1, 1973
616.0
-23.0
-3.6%
jan 1, 1974
667.0
+51.0
8.28%
jan 1, 1975
583.0
-84.0
-12.59%
jan 1, 1976
756.0
+173.0
29.67%
jan 1, 1977
730.0
-26.0
-3.44%
jan 1, 1978
851.0
+121.0
16.58%
jan 1, 1979
932.0
+81.0
9.52%
jan 1, 1980
798.0
-134.0
-14.38%
jan 1, 1981
1.03K
+232.0
29.07%
jan 1, 1986
3.647K
+2.617K
254.08%
jan 1, 1987
1.331K
-2.316K
-63.5%
jan 1, 1988
1.906K
+575.0
43.2%
jan 1, 1989
1.986K
+80.0
4.2%
jan 1, 1990
1.805K
-181.0
-9.11%
jan 1, 1991
1.909K
+104.0
5.76%
jan 1, 1992
2.067K
+158.0
8.28%
jan 1, 1993
2.348K
+281.0
13.59%
jan 1, 1994
4.22K
+1.872K
79.73%
jan 1, 1995
4.702K
+482.0
11.42%
jan 1, 1996
4.564K
-138.0
-2.93%
jan 1, 1997
9.654K
+5.09K
111.52%
jan 1, 1998
3.312K
-6.342K
-65.69%
jan 1, 1999
6.908K
+3.596K
108.57%
jan 1, 2000
3.283K
-3.625K
-52.48%
jan 1, 2001
7.392K
+4.109K
125.16%
jan 1, 2002
3.499K
-3.893K
-52.67%
jan 1, 2003
2.849K
-650.0
-18.58%
jan 1, 2004
2.875K
+26.0
0.91%
jan 1, 2005
8.498K
+5.623K
195.58%
jan 1, 2006
10.394K
+1.896K
22.31%
jan 1, 2007
9.958K
-436.0
-4.19%
jan 1, 2008
10.722K
+764.0
7.67%
jan 1, 2009
10.555K
-167.0
-1.56%
jan 1, 2010
10.721K
+166.0
1.57%
jan 1, 2011
11.023K
+302.0
2.82%
jan 1, 2012
11.052K
+29.0
0.26%
jan 1, 2013
11.231K
+179.0
1.62%
jan 1, 2014
11.338K
+107.0
0.95%
jan 1, 2015
11.708K
+370.0
3.26%
Ranking of countries by current statistics by years


Comments: