29
/
en
AIzaSyAYiBZKx7MnpbEhh9jyipgxe19OcubqV5w
April 1, 2024
165653
Jordan
JOR
true
2
1
Trademark applications, total
2015,2014,2013,2012,2011,2008,2007,2006,2005,2004,2003,2002,2001,1990,1983,1982,1981,1980,1979,1978,1977,1976,1975,1974,1973,1972,1970,1969,1968,1967,1966,1964
This statistics in other country:
AlbaniaAlgeriaAndorraAngolaAntigua and BarbudaArab WorldArgentinaArmeniaArubaAustraliaAustriaAzerbaijanBahamas, TheBahrainBangladeshBarbadosBelarusBelgiumBelizeBhutanBoliviaBosnia and HerzegovinaBotswanaBrazilBrunei DarussalamBulgariaBurkina FasoBurundiCabo VerdeCambodiaCanadaCaribbean small statesCentral Europe and the BalticsChileChinaColombiaComorosCongo, Dem. Rep.Costa RicaCroatiaCubaCuracaoCyprusCzech RepublicDenmarkDjiboutiDominicaDominican RepublicEarly-demographic dividendEast Asia & PacificEast Asia & Pacific (excluding high income)East Asia & Pacific (IDA & IBRD countries)EcuadorEgypt, Arab Rep.El SalvadorEquatorial GuineaEstoniaEthiopiaEuro areaEurope & Central AsiaEurope & Central Asia (excluding high income)Europe & Central Asia (IDA & IBRD countries)European UnionFijiFinlandFranceGambia, TheGeorgiaGermanyGhanaGreeceGrenadaGuatemalaGuineaGuinea-BissauGuyanaHaitiHigh incomeHondurasHong Kong SAR, ChinaHungaryIBRD onlyIcelandIDA & IBRD totalIDA blendIDA onlyIDA totalIndiaIndonesiaIran, Islamic Rep.IraqIrelandIsraelItalyJamaicaJapanJordanKazakhstanKenyaKiribatiKorea, Dem. People’s Rep.Korea, Rep.KuwaitKyrgyz RepublicLao PDRLate-demographic dividendLatin America & Caribbean Latin America & Caribbean (excluding high income)Latin America & the Caribbean (IDA & IBRD countries)LatviaLeast developed countries: UN classificationLebanonLesothoLiberiaLibyaLiechtensteinLithuaniaLow & middle incomeLower middle incomeLuxembourgMacao SAR, ChinaMacedonia, FYRMadagascarMalawiMalaysiaMaldivesMaliMaltaMauritiusMexicoMiddle East & North AfricaMiddle East & North Africa (excluding high income)Middle East & North Africa (IDA & IBRD countries)Middle incomeMoldovaMonacoMongoliaMontenegroMoroccoMozambiqueMyanmarNamibiaNepalNetherlandsNew ZealandNicaraguaNigeriaNorth AmericaNorwayOECD membersOmanOther small statesPacific island small statesPakistanPanamaPapua New GuineaParaguayPeruPhilippinesPolandPortugalPost-demographic dividendQatarRomaniaRussian FederationRwandaSamoaSan MarinoSao Tome and PrincipeSaudi ArabiaSerbiaSeychellesSierra LeoneSingaporeSint Maarten (Dutch part)Slovak RepublicSloveniaSmall statesSolomon IslandsSomaliaSouth AfricaSouth AsiaSouth Asia (IDA & IBRD)SpainSri LankaSt. LuciaSt. Vincent and the GrenadinesSudanSurinameSwazilandSwedenSwitzerlandSyrian Arab RepublicTajikistanTanzaniaThailandTongaTrinidad and TobagoTunisiaTurkeyTurkmenistanTuvaluUgandaUkraineUnited Arab EmiratesUnited KingdomUnited StatesUpper middle incomeUruguayUzbekistanVenezuela, RBVietnamWorldYemen, Rep.ZambiaZimbabwe Timeline:
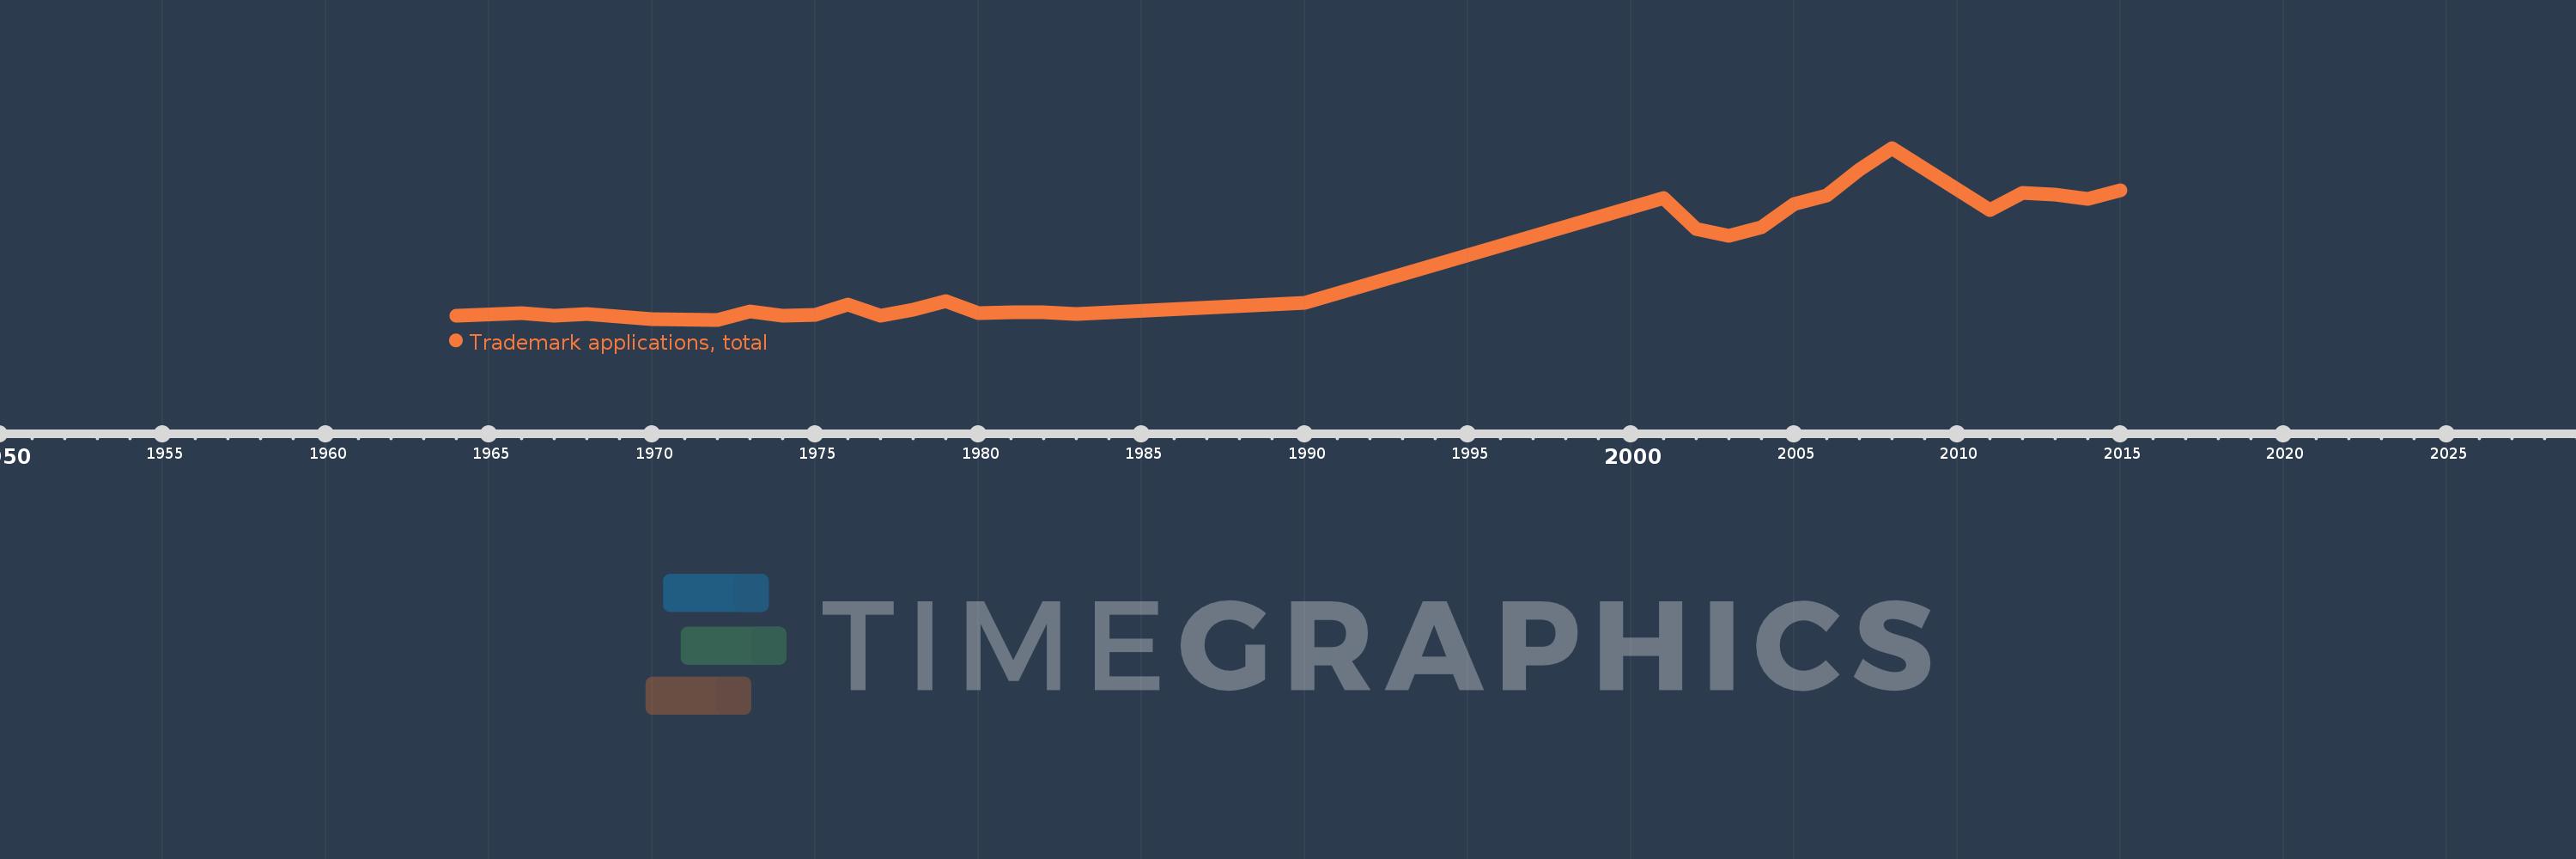
This timeline shows a graph from 1964 to 2015 of Jordan. No data until 1963. Number of actual observations by date: 32.
Source name:
World Development Indicators
Source organization:
World Intellectual Property Organization (WIPO), World Intellectual Property Indicators and www.wipo.int/econ_stat. The International Bureau of WIPO assumes no responsibility with respect to the transformation of these data.
Categories, topics:
Science & Technology
Last updated:
apr 23, 2017
Indicators value changes by year
Maximum:
9.145K
jan 1, 2008
At the date of observation
Value
Absolute change
Change from previous value
jan 1, 1964
530.0
+530.0
0.0%
jan 1, 1966
668.0
+138.0
26.04%
jan 1, 1967
535.0
-133.0
-19.91%
jan 1, 1968
621.0
+86.0
16.07%
jan 1, 1969
489.0
-132.0
-21.26%
jan 1, 1970
332.0
-157.0
-32.11%
jan 1, 1972
306.0
-26.0
-7.83%
jan 1, 1973
714.0
+408.0
133.33%
jan 1, 1974
521.0
-193.0
-27.03%
jan 1, 1975
555.0
+34.0
6.53%
jan 1, 1976
1.09K
+535.0
96.4%
jan 1, 1977
535.0
-555.0
-50.92%
jan 1, 1978
811.0
+276.0
51.59%
jan 1, 1979
1.26K
+449.0
55.36%
jan 1, 1980
628.0
-632.0
-50.16%
jan 1, 1981
707.0
+79.0
12.58%
jan 1, 1982
691.0
-16.0
-2.26%
jan 1, 1983
612.0
-79.0
-11.43%
jan 1, 1990
1.197K
+585.0
95.59%
jan 1, 2001
6.573K
+5.376K
449.12%
jan 1, 2002
4.975K
-1.598K
-24.31%
jan 1, 2003
4.632K
-343.0
-6.89%
jan 1, 2004
5.076K
+444.0
9.59%
jan 1, 2005
6.257K
+1.181K
23.27%
jan 1, 2006
6.716K
+459.0
7.34%
jan 1, 2007
8.013K
+1.297K
19.31%
jan 1, 2008
9.145K
+1.132K
14.13%
jan 1, 2011
5.971K
-3.174K
-34.71%
jan 1, 2012
6.812K
+841.0
14.08%
jan 1, 2013
6.751K
-61.0
-0.9%
jan 1, 2014
6.51K
-241.0
-3.57%
jan 1, 2015
6.958K
+448.0
6.88%
Ranking of countries by current statistics by years


Comments: