29
/
en
AIzaSyAYiBZKx7MnpbEhh9jyipgxe19OcubqV5w
April 1, 2024
270172
Turkey
TUR
true
2
1
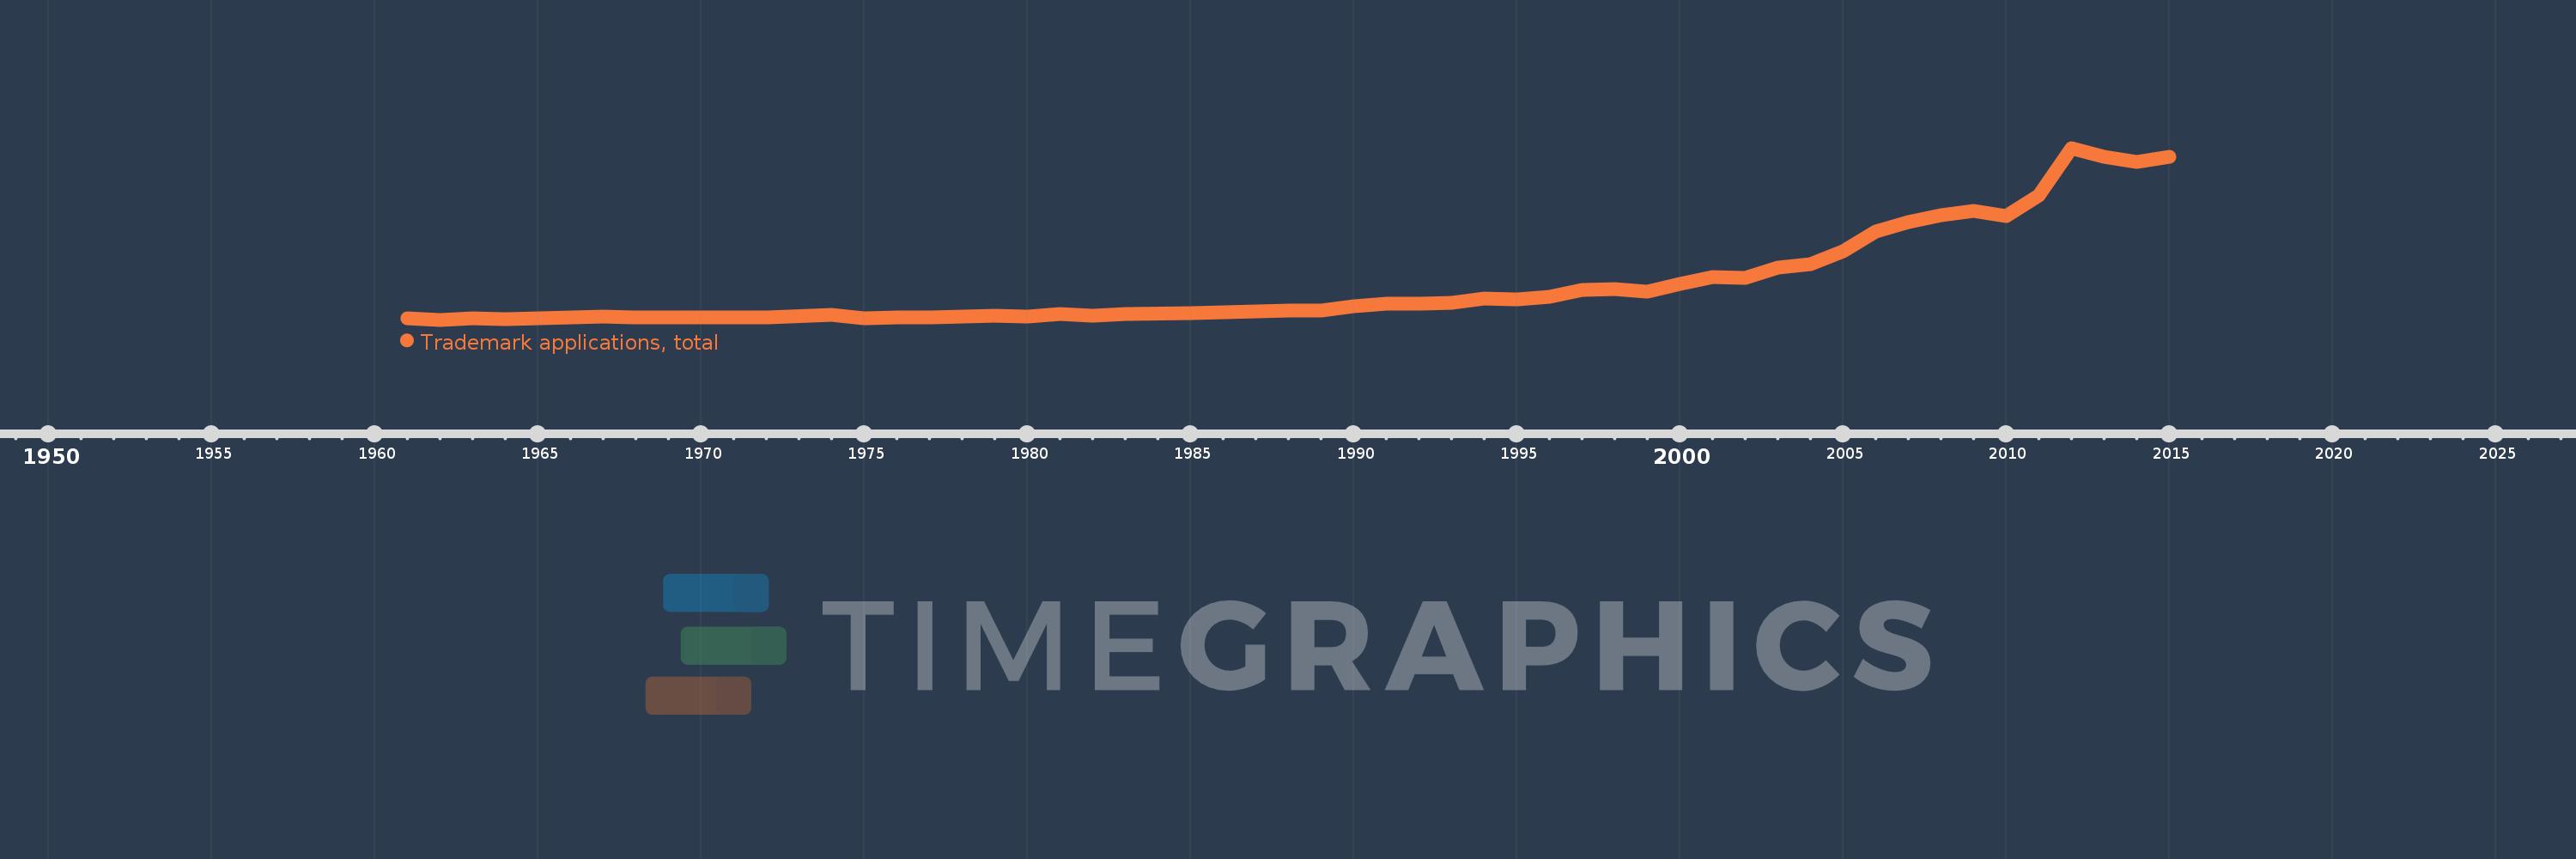
Trademark applications, total
2015,2014,2013,2012,2011,2010,2009,2008,2007,2006,2005,2004,2003,2002,2001,2000,1999,1998,1997,1996,1995,1994,1993,1992,1991,1990,1989,1988,1987,1986,1985,1983,1982,1981,1980,1979,1978,1977,1976,1975,1974,1972,1971,1970,1969,1968,1967,1966,1965,1964,1963,1962,1961
This statistics in other country:
AlbaniaAlgeriaAndorraAngolaAntigua and BarbudaArab WorldArgentinaArmeniaArubaAustraliaAustriaAzerbaijanBahamas, TheBahrainBangladeshBarbadosBelarusBelgiumBelizeBhutanBoliviaBosnia and HerzegovinaBotswanaBrazilBrunei DarussalamBulgariaBurkina FasoBurundiCabo VerdeCambodiaCanadaCaribbean small statesCentral Europe and the BalticsChileChinaColombiaComorosCongo, Dem. Rep.Costa RicaCroatiaCubaCuracaoCyprusCzech RepublicDenmarkDjiboutiDominicaDominican RepublicEarly-demographic dividendEast Asia & PacificEast Asia & Pacific (excluding high income)East Asia & Pacific (IDA & IBRD countries)EcuadorEgypt, Arab Rep.El SalvadorEquatorial GuineaEstoniaEthiopiaEuro areaEurope & Central AsiaEurope & Central Asia (excluding high income)Europe & Central Asia (IDA & IBRD countries)European UnionFijiFinlandFranceGambia, TheGeorgiaGermanyGhanaGreeceGrenadaGuatemalaGuineaGuinea-BissauGuyanaHaitiHigh incomeHondurasHong Kong SAR, ChinaHungaryIBRD onlyIcelandIDA & IBRD totalIDA blendIDA onlyIDA totalIndiaIndonesiaIran, Islamic Rep.IraqIrelandIsraelItalyJamaicaJapanJordanKazakhstanKenyaKiribatiKorea, Dem. People’s Rep.Korea, Rep.KuwaitKyrgyz RepublicLao PDRLate-demographic dividendLatin America & Caribbean Latin America & Caribbean (excluding high income)Latin America & the Caribbean (IDA & IBRD countries)LatviaLeast developed countries: UN classificationLebanonLesothoLiberiaLibyaLiechtensteinLithuaniaLow & middle incomeLower middle incomeLuxembourgMacao SAR, ChinaMacedonia, FYRMadagascarMalawiMalaysiaMaldivesMaliMaltaMauritiusMexicoMiddle East & North AfricaMiddle East & North Africa (excluding high income)Middle East & North Africa (IDA & IBRD countries)Middle incomeMoldovaMonacoMongoliaMontenegroMoroccoMozambiqueMyanmarNamibiaNepalNetherlandsNew ZealandNicaraguaNigeriaNorth AmericaNorwayOECD membersOmanOther small statesPacific island small statesPakistanPanamaPapua New GuineaParaguayPeruPhilippinesPolandPortugalPost-demographic dividendQatarRomaniaRussian FederationRwandaSamoaSan MarinoSao Tome and PrincipeSaudi ArabiaSerbiaSeychellesSierra LeoneSingaporeSint Maarten (Dutch part)Slovak RepublicSloveniaSmall statesSolomon IslandsSomaliaSouth AfricaSouth AsiaSouth Asia (IDA & IBRD)SpainSri LankaSt. LuciaSt. Vincent and the GrenadinesSudanSurinameSwazilandSwedenSwitzerlandSyrian Arab RepublicTajikistanTanzaniaThailandTongaTrinidad and TobagoTunisiaTurkeyTurkmenistanTuvaluUgandaUkraineUnited Arab EmiratesUnited KingdomUnited StatesUpper middle incomeUruguayUzbekistanVenezuela, RBVietnamWorldYemen, Rep.ZambiaZimbabwe Timeline:
This timeline shows a graph from 1961 to 2015 of Turkey. No data until 1960. Number of actual observations by date: 53.
Source name:
World Development Indicators
Source organization:
World Intellectual Property Organization (WIPO), World Intellectual Property Indicators and www.wipo.int/econ_stat. The International Bureau of WIPO assumes no responsibility with respect to the transformation of these data.
Categories, topics:
Science & Technology
Last updated:
apr 23, 2017
Indicators value changes by year
Maximum:
117.754K
jan 1, 2012
At the date of observation
Value
Absolute change
Change from previous value
jan 1, 1961
1.34K
+1.34K
0.0%
jan 1, 1962
454.0
-886.0
-66.12%
jan 1, 1963
1.63K
+1.176K
259.03%
jan 1, 1964
1.152K
-478.0
-29.33%
jan 1, 1965
1.638K
+486.0
42.19%
jan 1, 1966
2.142K
+504.0
30.77%
jan 1, 1967
2.608K
+466.0
21.76%
jan 1, 1968
2.188K
-420.0
-16.1%
jan 1, 1969
1.96K
-228.0
-10.42%
jan 1, 1970
1.952K
-8.0
-0.41%
jan 1, 1971
1.983K
+31.0
1.59%
jan 1, 1972
2.048K
+65.0
3.28%
jan 1, 1974
3.809K
+1.761K
85.99%
jan 1, 1975
1.736K
-2.073K
-54.42%
jan 1, 1976
2.081K
+345.0
19.87%
jan 1, 1977
1.851K
-230.0
-11.05%
jan 1, 1978
2.683K
+832.0
44.95%
jan 1, 1979
3.171K
+488.0
18.19%
jan 1, 1980
2.852K
-319.0
-10.06%
jan 1, 1981
4.129K
+1.277K
44.78%
jan 1, 1982
3.313K
-816.0
-19.76%
jan 1, 1983
4.098K
+785.0
23.69%
jan 1, 1985
4.876K
+778.0
18.98%
jan 1, 1986
5.807K
+931.0
19.09%
jan 1, 1987
6.369K
+562.0
9.68%
jan 1, 1988
6.559K
+190.0
2.98%
jan 1, 1989
6.898K
+339.0
5.17%
jan 1, 1990
9.42K
+2.522K
36.56%
jan 1, 1991
11.343K
+1.923K
20.41%
jan 1, 1992
11.45K
+107.0
0.94%
jan 1, 1993
12.022K
+572.0
5.0%
jan 1, 1994
14.85K
+2.828K
23.52%
jan 1, 1995
14.402K
-448.0
-3.02%
jan 1, 1996
16.194K
+1.792K
12.44%
jan 1, 1997
20.662K
+4.468K
27.59%
jan 1, 1998
21.1K
+438.0
2.12%
jan 1, 1999
19.79K
-1.31K
-6.21%
jan 1, 2000
24.622K
+4.832K
24.42%
jan 1, 2001
29.532K
+4.91K
19.94%
jan 1, 2002
28.917K
-615.0
-2.08%
jan 1, 2003
36.245K
+7.328K
25.34%
jan 1, 2004
38.577K
+2.332K
6.43%
jan 1, 2005
47.195K
+8.618K
22.34%
jan 1, 2006
60.697K
+13.502K
28.61%
jan 1, 2007
67.3K
+6.603K
10.88%
jan 1, 2008
72.034K
+4.734K
7.03%
jan 1, 2009
74.685K
+2.651K
3.68%
jan 1, 2010
71.466K
-3.219K
-4.31%
jan 1, 2011
85.466K
+14.0K
19.59%
jan 1, 2012
117.754K
+32.288K
37.78%
jan 1, 2013
111.699K
-6.055K
-5.14%
jan 1, 2014
108.087K
-3.612K
-3.23%
jan 1, 2015
111.627K
+3.54K
3.28%
Ranking of countries by current statistics by years


Comments: