29
/
en
AIzaSyAYiBZKx7MnpbEhh9jyipgxe19OcubqV5w
April 1, 2024
187324
Malawi
MWI
true
2
1
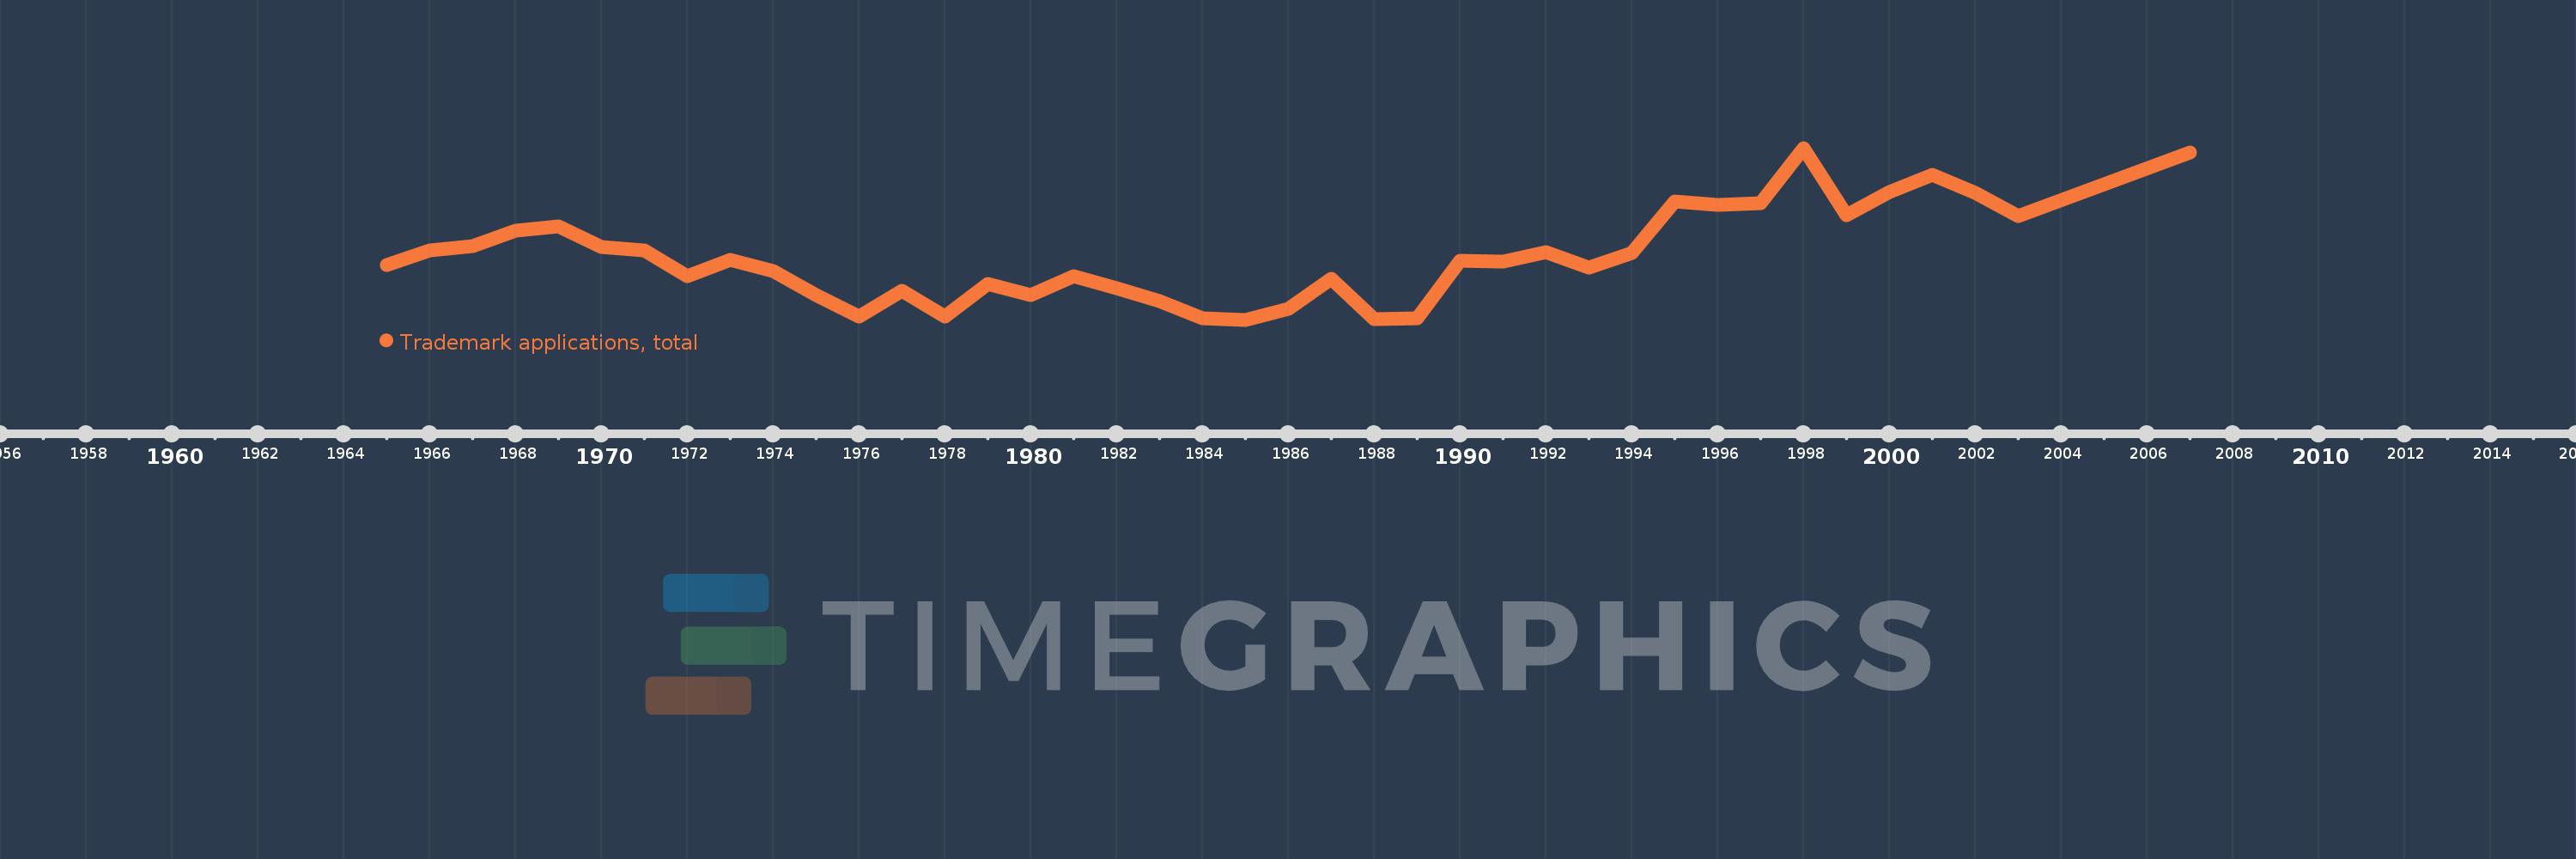
Trademark applications, total
2007,2003,2002,2001,2000,1999,1998,1997,1996,1995,1994,1993,1992,1991,1990,1989,1988,1987,1986,1985,1984,1983,1982,1981,1980,1979,1978,1977,1976,1975,1974,1973,1972,1971,1970,1969,1968,1967,1966,1965
This statistics in other country:
AlbaniaAlgeriaAndorraAngolaAntigua and BarbudaArab WorldArgentinaArmeniaArubaAustraliaAustriaAzerbaijanBahamas, TheBahrainBangladeshBarbadosBelarusBelgiumBelizeBhutanBoliviaBosnia and HerzegovinaBotswanaBrazilBrunei DarussalamBulgariaBurkina FasoBurundiCabo VerdeCambodiaCanadaCaribbean small statesCentral Europe and the BalticsChileChinaColombiaComorosCongo, Dem. Rep.Costa RicaCroatiaCubaCuracaoCyprusCzech RepublicDenmarkDjiboutiDominicaDominican RepublicEarly-demographic dividendEast Asia & PacificEast Asia & Pacific (excluding high income)East Asia & Pacific (IDA & IBRD countries)EcuadorEgypt, Arab Rep.El SalvadorEquatorial GuineaEstoniaEthiopiaEuro areaEurope & Central AsiaEurope & Central Asia (excluding high income)Europe & Central Asia (IDA & IBRD countries)European UnionFijiFinlandFranceGambia, TheGeorgiaGermanyGhanaGreeceGrenadaGuatemalaGuineaGuinea-BissauGuyanaHaitiHigh incomeHondurasHong Kong SAR, ChinaHungaryIBRD onlyIcelandIDA & IBRD totalIDA blendIDA onlyIDA totalIndiaIndonesiaIran, Islamic Rep.IraqIrelandIsraelItalyJamaicaJapanJordanKazakhstanKenyaKiribatiKorea, Dem. People’s Rep.Korea, Rep.KuwaitKyrgyz RepublicLao PDRLate-demographic dividendLatin America & Caribbean Latin America & Caribbean (excluding high income)Latin America & the Caribbean (IDA & IBRD countries)LatviaLeast developed countries: UN classificationLebanonLesothoLiberiaLibyaLiechtensteinLithuaniaLow & middle incomeLower middle incomeLuxembourgMacao SAR, ChinaMacedonia, FYRMadagascarMalawiMalaysiaMaldivesMaliMaltaMauritiusMexicoMiddle East & North AfricaMiddle East & North Africa (excluding high income)Middle East & North Africa (IDA & IBRD countries)Middle incomeMoldovaMonacoMongoliaMontenegroMoroccoMozambiqueMyanmarNamibiaNepalNetherlandsNew ZealandNicaraguaNigeriaNorth AmericaNorwayOECD membersOmanOther small statesPacific island small statesPakistanPanamaPapua New GuineaParaguayPeruPhilippinesPolandPortugalPost-demographic dividendQatarRomaniaRussian FederationRwandaSamoaSan MarinoSao Tome and PrincipeSaudi ArabiaSerbiaSeychellesSierra LeoneSingaporeSint Maarten (Dutch part)Slovak RepublicSloveniaSmall statesSolomon IslandsSomaliaSouth AfricaSouth AsiaSouth Asia (IDA & IBRD)SpainSri LankaSt. LuciaSt. Vincent and the GrenadinesSudanSurinameSwazilandSwedenSwitzerlandSyrian Arab RepublicTajikistanTanzaniaThailandTongaTrinidad and TobagoTunisiaTurkeyTurkmenistanTuvaluUgandaUkraineUnited Arab EmiratesUnited KingdomUnited StatesUpper middle incomeUruguayUzbekistanVenezuela, RBVietnamWorldYemen, Rep.ZambiaZimbabwe Timeline:
This timeline shows a graph from 1965 to 2007 of Malawi. No data until 1964. Number of actual observations by date: 40.
Source name:
World Development Indicators
Source organization:
World Intellectual Property Organization (WIPO), World Intellectual Property Indicators and www.wipo.int/econ_stat. The International Bureau of WIPO assumes no responsibility with respect to the transformation of these data.
Categories, topics:
Science & Technology
Last updated:
apr 23, 2017
Indicators value changes by year
At the date of observation
Value
Absolute change
Change from previous value
jan 1, 1965
406.0
+406.0
0.0%
jan 1, 1966
457.0
+51.0
12.56%
jan 1, 1967
472.0
+15.0
3.28%
jan 1, 1968
528.0
+56.0
11.86%
jan 1, 1969
542.0
+14.0
2.65%
jan 1, 1970
469.0
-73.0
-13.47%
jan 1, 1971
458.0
-11.0
-2.35%
jan 1, 1972
367.0
-91.0
-19.87%
jan 1, 1973
426.0
+59.0
16.08%
jan 1, 1974
386.0
-40.0
-9.39%
jan 1, 1975
302.0
-84.0
-21.76%
jan 1, 1976
226.0
-76.0
-25.17%
jan 1, 1977
317.0
+91.0
40.27%
jan 1, 1978
224.0
-93.0
-29.34%
jan 1, 1979
340.0
+116.0
51.79%
jan 1, 1980
300.0
-40.0
-11.76%
jan 1, 1981
368.0
+68.0
22.67%
jan 1, 1982
326.0
-42.0
-11.41%
jan 1, 1983
281.0
-45.0
-13.8%
jan 1, 1984
218.0
-63.0
-22.42%
jan 1, 1985
214.0
-4.0
-1.83%
jan 1, 1986
253.0
+39.0
18.22%
jan 1, 1987
358.0
+105.0
41.5%
jan 1, 1988
216.0
-142.0
-39.66%
jan 1, 1989
218.0
+2.0
0.93%
jan 1, 1990
422.0
+204.0
93.58%
jan 1, 1991
419.0
-3.0
-0.71%
jan 1, 1992
452.0
+33.0
7.88%
jan 1, 1993
399.0
-53.0
-11.73%
jan 1, 1994
449.0
+50.0
12.53%
jan 1, 1995
632.0
+183.0
40.76%
jan 1, 1996
618.0
-14.0
-2.22%
jan 1, 1997
624.0
+6.0
0.97%
jan 1, 1998
819.0
+195.0
31.25%
jan 1, 1999
582.0
-237.0
-28.94%
jan 1, 2000
665.0
+83.0
14.26%
jan 1, 2001
723.0
+58.0
8.72%
jan 1, 2002
661.0
-62.0
-8.58%
jan 1, 2003
578.0
-83.0
-12.56%
jan 1, 2007
804.0
+226.0
39.1%
Ranking of countries by current statistics by years


Comments: