29
/
en
AIzaSyAYiBZKx7MnpbEhh9jyipgxe19OcubqV5w
April 1, 2024
77712
Bahrain
BHR
true
2
1
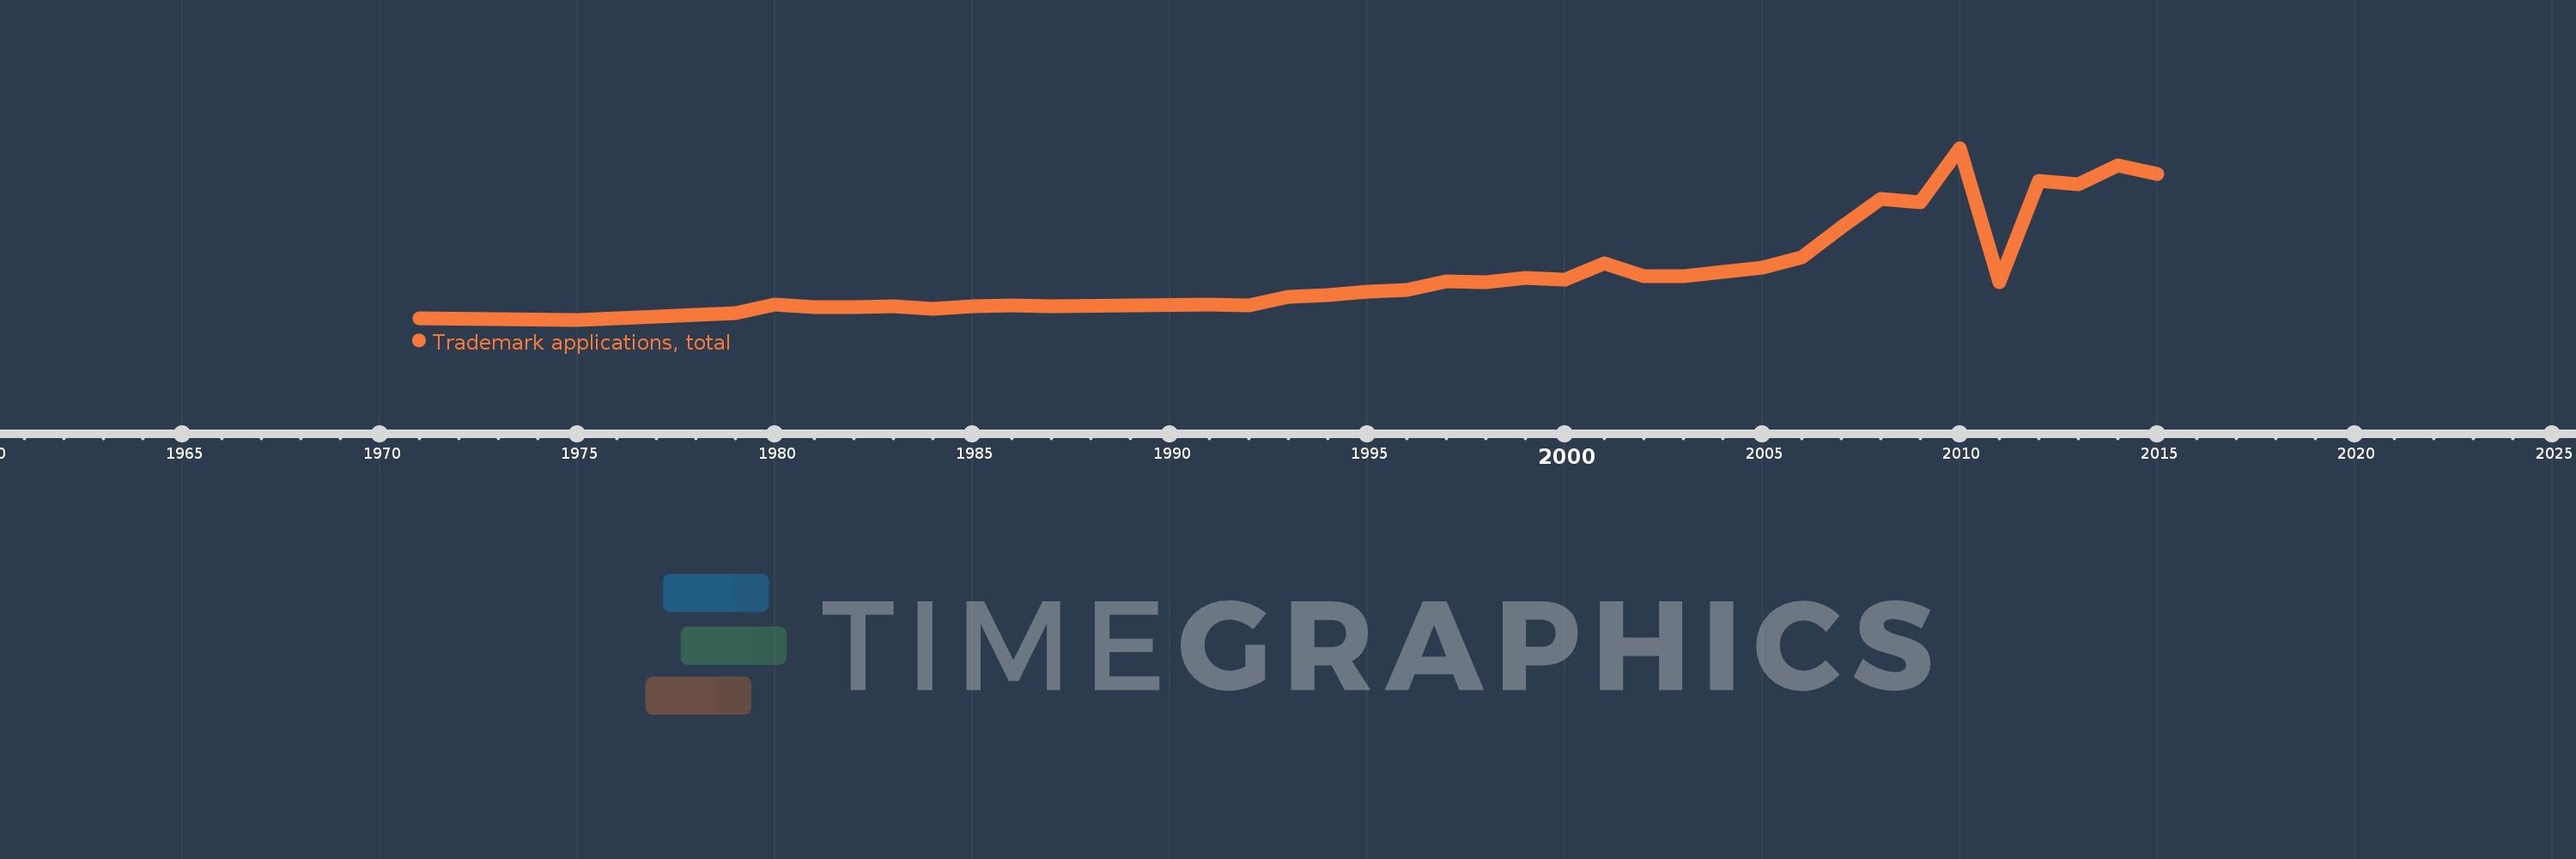
Trademark applications, total
2015,2014,2013,2012,2011,2010,2009,2008,2007,2006,2005,2004,2003,2002,2001,2000,1999,1998,1997,1996,1995,1994,1993,1992,1991,1987,1986,1985,1984,1983,1982,1981,1980,1979,1975,1971
This statistics in other country:
AlbaniaAlgeriaAndorraAngolaAntigua and BarbudaArab WorldArgentinaArmeniaArubaAustraliaAustriaAzerbaijanBahamas, TheBahrainBangladeshBarbadosBelarusBelgiumBelizeBhutanBoliviaBosnia and HerzegovinaBotswanaBrazilBrunei DarussalamBulgariaBurkina FasoBurundiCabo VerdeCambodiaCanadaCaribbean small statesCentral Europe and the BalticsChileChinaColombiaComorosCongo, Dem. Rep.Costa RicaCroatiaCubaCuracaoCyprusCzech RepublicDenmarkDjiboutiDominicaDominican RepublicEarly-demographic dividendEast Asia & PacificEast Asia & Pacific (excluding high income)East Asia & Pacific (IDA & IBRD countries)EcuadorEgypt, Arab Rep.El SalvadorEquatorial GuineaEstoniaEthiopiaEuro areaEurope & Central AsiaEurope & Central Asia (excluding high income)Europe & Central Asia (IDA & IBRD countries)European UnionFijiFinlandFranceGambia, TheGeorgiaGermanyGhanaGreeceGrenadaGuatemalaGuineaGuinea-BissauGuyanaHaitiHigh incomeHondurasHong Kong SAR, ChinaHungaryIBRD onlyIcelandIDA & IBRD totalIDA blendIDA onlyIDA totalIndiaIndonesiaIran, Islamic Rep.IraqIrelandIsraelItalyJamaicaJapanJordanKazakhstanKenyaKiribatiKorea, Dem. People’s Rep.Korea, Rep.KuwaitKyrgyz RepublicLao PDRLate-demographic dividendLatin America & Caribbean Latin America & Caribbean (excluding high income)Latin America & the Caribbean (IDA & IBRD countries)LatviaLeast developed countries: UN classificationLebanonLesothoLiberiaLibyaLiechtensteinLithuaniaLow & middle incomeLower middle incomeLuxembourgMacao SAR, ChinaMacedonia, FYRMadagascarMalawiMalaysiaMaldivesMaliMaltaMauritiusMexicoMiddle East & North AfricaMiddle East & North Africa (excluding high income)Middle East & North Africa (IDA & IBRD countries)Middle incomeMoldovaMonacoMongoliaMontenegroMoroccoMozambiqueMyanmarNamibiaNepalNetherlandsNew ZealandNicaraguaNigeriaNorth AmericaNorwayOECD membersOmanOther small statesPacific island small statesPakistanPanamaPapua New GuineaParaguayPeruPhilippinesPolandPortugalPost-demographic dividendQatarRomaniaRussian FederationRwandaSamoaSan MarinoSao Tome and PrincipeSaudi ArabiaSerbiaSeychellesSierra LeoneSingaporeSint Maarten (Dutch part)Slovak RepublicSloveniaSmall statesSolomon IslandsSomaliaSouth AfricaSouth AsiaSouth Asia (IDA & IBRD)SpainSri LankaSt. LuciaSt. Vincent and the GrenadinesSudanSurinameSwazilandSwedenSwitzerlandSyrian Arab RepublicTajikistanTanzaniaThailandTongaTrinidad and TobagoTunisiaTurkeyTurkmenistanTuvaluUgandaUkraineUnited Arab EmiratesUnited KingdomUnited StatesUpper middle incomeUruguayUzbekistanVenezuela, RBVietnamWorldYemen, Rep.ZambiaZimbabwe Timeline:
This timeline shows a graph from 1971 to 2015 of Bahrain. No data until 1970. Number of actual observations by date: 36.
Source name:
World Development Indicators
Source organization:
World Intellectual Property Organization (WIPO), World Intellectual Property Indicators and www.wipo.int/econ_stat. The International Bureau of WIPO assumes no responsibility with respect to the transformation of these data.
Categories, topics:
Science & Technology
Last updated:
apr 23, 2017
Indicators value changes by year
Maximum:
8.891K
jan 1, 2010
At the date of observation
Value
Absolute change
Change from previous value
jan 1, 1971
205.0
+205.0
0.0%
jan 1, 1975
142.0
-63.0
-30.73%
jan 1, 1979
493.0
+351.0
247.18%
jan 1, 1980
915.0
+422.0
85.6%
jan 1, 1981
790.0
-125.0
-13.66%
jan 1, 1982
779.0
-11.0
-1.39%
jan 1, 1983
807.0
+28.0
3.59%
jan 1, 1984
696.0
-111.0
-13.75%
jan 1, 1985
812.0
+116.0
16.67%
jan 1, 1986
866.0
+54.0
6.65%
jan 1, 1987
809.0
-57.0
-6.58%
jan 1, 1991
929.0
+120.0
14.83%
jan 1, 1992
854.0
-75.0
-8.07%
jan 1, 1993
1.319K
+465.0
54.45%
jan 1, 1994
1.404K
+85.0
6.44%
jan 1, 1995
1.56K
+156.0
11.11%
jan 1, 1996
1.641K
+81.0
5.19%
jan 1, 1997
2.103K
+462.0
28.15%
jan 1, 1998
2.046K
-57.0
-2.71%
jan 1, 1999
2.253K
+207.0
10.12%
jan 1, 2000
2.18K
-73.0
-3.24%
jan 1, 2001
2.998K
+818.0
37.52%
jan 1, 2002
2.342K
-656.0
-21.88%
jan 1, 2003
2.378K
+36.0
1.54%
jan 1, 2004
2.558K
+180.0
7.57%
jan 1, 2005
2.793K
+235.0
9.19%
jan 1, 2006
3.334K
+541.0
19.37%
jan 1, 2007
4.851K
+1.517K
45.5%
jan 1, 2008
6.312K
+1.461K
30.12%
jan 1, 2009
6.116K
-196.0
-3.11%
jan 1, 2010
8.891K
+2.775K
45.37%
jan 1, 2011
2.041K
-6.85K
-77.04%
jan 1, 2012
7.21K
+5.169K
253.26%
jan 1, 2013
7.026K
-184.0
-2.55%
jan 1, 2014
7.999K
+973.0
13.85%
jan 1, 2015
7.563K
-436.0
-5.45%
Ranking of countries by current statistics by years


Comments: