29
/
en
AIzaSyAYiBZKx7MnpbEhh9jyipgxe19OcubqV5w
April 1, 2024
69688
Argentina
ARG
true
2
1
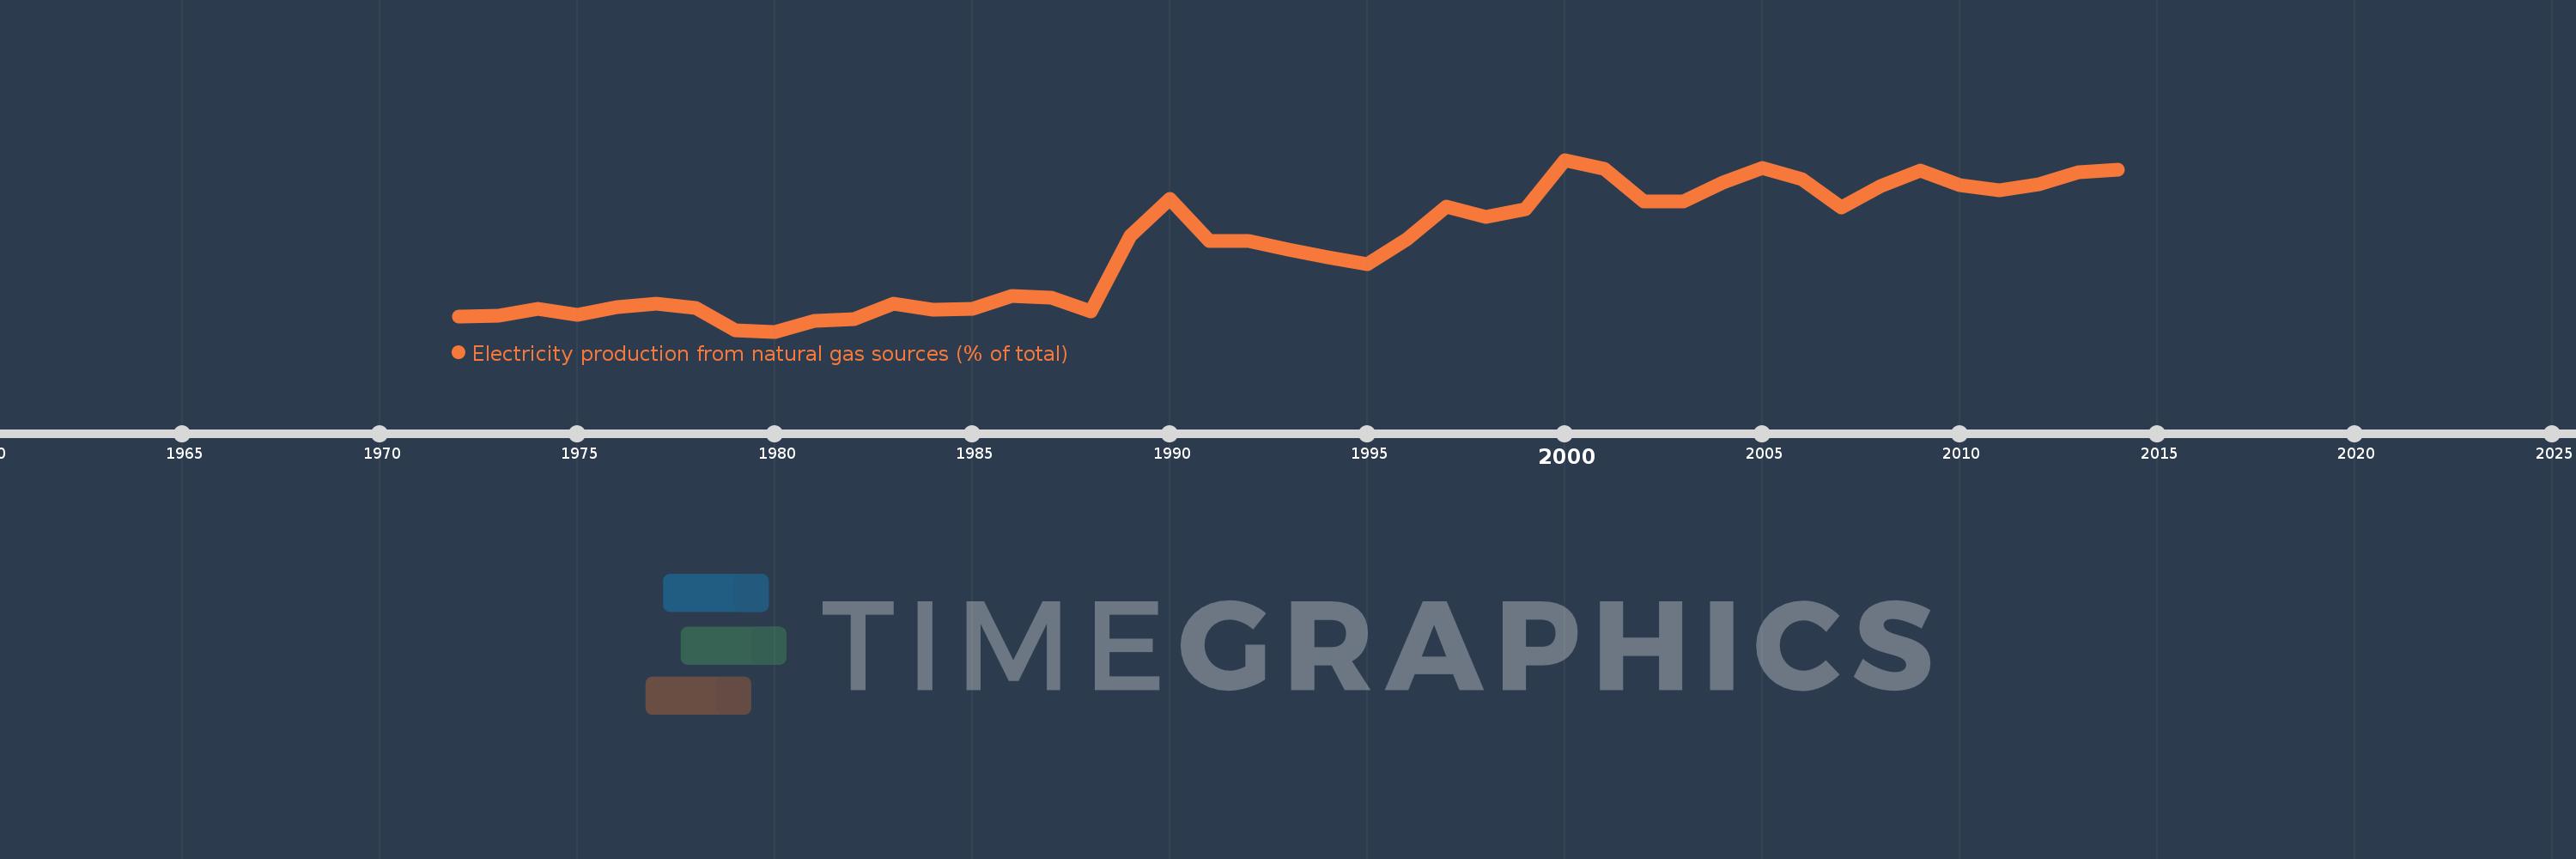
Electricity production from natural gas sources (% of total)
2014,2013,2012,2011,2010,2009,2008,2007,2006,2005,2004,2003,2002,2001,2000,1999,1998,1997,1996,1995,1994,1993,1992,1991,1990,1989,1988,1987,1986,1985,1984,1983,1982,1981,1980,1979,1978,1977,1976,1975,1974,1973,1972
This statistics in other country:
AlbaniaAlgeriaAngolaArab WorldArgentinaArmeniaAustraliaAustriaAzerbaijanBahrainBangladeshBelarusBelgiumBeninBoliviaBosnia and HerzegovinaBotswanaBrazilBrunei DarussalamBulgariaCambodiaCameroonCanadaCentral Europe and the BalticsChileChinaColombiaCongo, Dem. Rep.Congo, Rep.Costa RicaCote d'IvoireCroatiaCubaCuracaoCyprusCzech RepublicDenmarkDominican RepublicEarly-demographic dividendEast Asia & PacificEast Asia & Pacific (excluding high income)East Asia & Pacific (IDA & IBRD countries)EcuadorEgypt, Arab Rep.El SalvadorEritreaEstoniaEthiopiaEuro areaEurope & Central AsiaEurope & Central Asia (excluding high income)Europe & Central Asia (IDA & IBRD countries)European UnionFinlandFragile and conflict affected situationsFranceGabonGeorgiaGermanyGhanaGibraltarGreeceGuatemalaHaitiHeavily indebted poor countries (HIPC)High incomeHondurasHong Kong SAR, ChinaHungaryIBRD onlyIcelandIDA & IBRD totalIDA blendIDA onlyIDA totalIndiaIndonesiaIran, Islamic Rep.IraqIrelandIsraelItalyJamaicaJapanJordanKazakhstanKenyaKorea, Dem. People’s Rep.Korea, Rep.KosovoKuwaitKyrgyz RepublicLate-demographic dividendLatin America & Caribbean Latin America & Caribbean (excluding high income)Latin America & the Caribbean (IDA & IBRD countries)LatviaLeast developed countries: UN classificationLebanonLibyaLithuaniaLow & middle incomeLower middle incomeLuxembourgMacedonia, FYRMalaysiaMaltaMauritiusMexicoMiddle East & North AfricaMiddle East & North Africa (excluding high income)Middle East & North Africa (IDA & IBRD countries)Middle incomeMoldovaMongoliaMontenegroMoroccoMozambiqueMyanmarNamibiaNepalNetherlandsNew ZealandNicaraguaNigerNigeriaNorth AmericaNorwayOECD membersOmanOther small statesPakistanPanamaParaguayPeruPhilippinesPolandPortugalPost-demographic dividendPre-demographic dividendQatarRomaniaRussian FederationSaudi ArabiaSenegalSerbiaSingaporeSlovak RepublicSloveniaSmall statesSouth AfricaSouth AsiaSouth Asia (IDA & IBRD)South SudanSpainSri LankaSub-Saharan Africa Sub-Saharan Africa (excluding high income)Sub-Saharan Africa (IDA & IBRD countries)SudanSwedenSwitzerlandSyrian Arab RepublicTajikistanTanzaniaThailandTogoTrinidad and TobagoTunisiaTurkeyTurkmenistanUkraineUnited Arab EmiratesUnited KingdomUnited StatesUpper middle incomeUruguayUzbekistanVenezuela, RBVietnamWorldYemen, Rep.ZambiaZimbabwe Timeline:
This timeline shows a graph from 1972 to 2014 of Argentina. No data until 1971. Number of actual observations by date: 43.
Source name:
World Development Indicators
Source organization:
IEA Statistics © OECD/IEA 2014 (http://www.iea.org/stats/index.asp), subject to https://www.iea.org/t&c/termsandconditions/
Categories, topics:
Energy & Mining, Climate Change, Infrastructure
Last updated:
apr 23, 2017
Indicators value changes by year
Minimum:
19.702
jan 1, 1980
Maximum:
56.605
jan 1, 2000
At the date of observation
Value
Absolute change
Change from previous value
jan 1, 1972
22.926
+22.926
0.0%
jan 1, 1973
23.188
+0.262
1.14%
jan 1, 1974
24.541
+1.353
5.84%
jan 1, 1975
23.302
-1.239
-5.05%
jan 1, 1976
24.882
+1.579
6.78%
jan 1, 1977
25.669
+0.787
3.16%
jan 1, 1978
24.799
-0.87
-3.39%
jan 1, 1979
19.899
-4.9
-19.76%
jan 1, 1980
19.702
-0.197
-0.99%
jan 1, 1981
22.022
+2.32
11.78%
jan 1, 1982
22.426
+0.404
1.83%
jan 1, 1983
25.658
+3.232
14.41%
jan 1, 1984
24.422
-1.237
-4.82%
jan 1, 1985
24.565
+0.144
0.59%
jan 1, 1986
27.447
+2.882
11.73%
jan 1, 1987
27.078
-0.369
-1.35%
jan 1, 1988
24.08
-2.998
-11.07%
jan 1, 1989
40.334
+16.254
67.5%
jan 1, 1990
48.146
+7.812
19.37%
jan 1, 1991
39.164
-8.982
-18.65%
jan 1, 1992
39.164
0.0
0.0%
jan 1, 1993
37.256
-1.908
-4.87%
jan 1, 1994
35.694
-1.562
-4.19%
jan 1, 1995
34.095
-1.599
-4.48%
jan 1, 1996
39.509
+5.414
15.88%
jan 1, 1997
46.47
+6.961
17.62%
jan 1, 1998
44.267
-2.203
-4.74%
jan 1, 1999
46.04
+1.773
4.01%
jan 1, 2000
56.605
+10.565
22.95%
jan 1, 2001
54.647
-1.957
-3.46%
jan 1, 2002
47.711
-6.936
-12.69%
jan 1, 2003
47.685
-0.027
-0.06%
jan 1, 2004
51.71
+4.026
8.44%
jan 1, 2005
54.802
+3.091
5.98%
jan 1, 2006
52.446
-2.355
-4.3%
jan 1, 2007
46.29
-6.156
-11.74%
jan 1, 2008
51.049
+4.758
10.28%
jan 1, 2009
54.217
+3.168
6.21%
jan 1, 2010
51.229
-2.988
-5.51%
jan 1, 2011
50.135
-1.094
-2.14%
jan 1, 2012
51.285
+1.149
2.29%
jan 1, 2013
53.873
+2.588
5.05%
jan 1, 2014
54.447
+0.574
1.06%
Ranking of countries by current statistics by years


Comments: