29
/
en
AIzaSyAYiBZKx7MnpbEhh9jyipgxe19OcubqV5w
April 1, 2024
187666
Malaysia
MYS
true
2
1
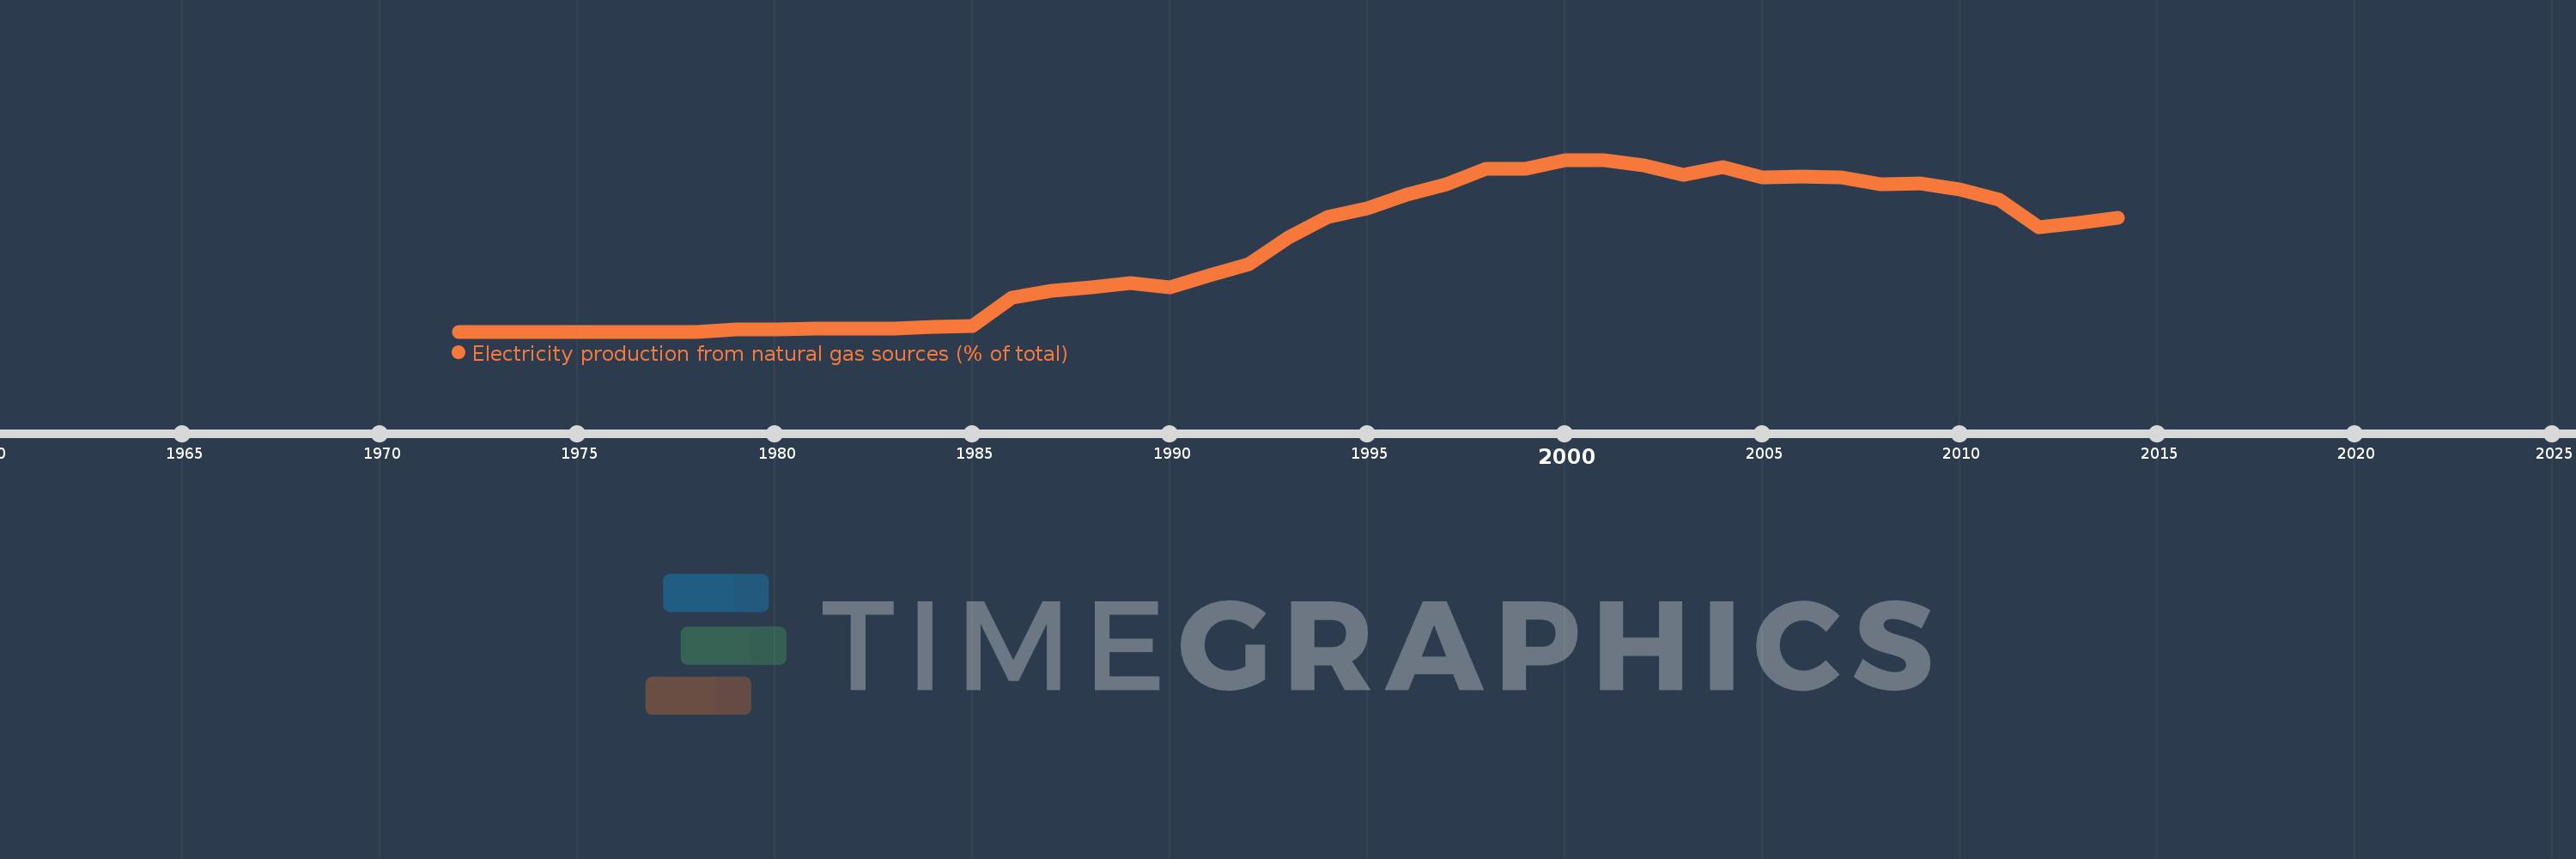
Electricity production from natural gas sources (% of total)
2014,2013,2012,2011,2010,2009,2008,2007,2006,2005,2004,2003,2002,2001,2000,1999,1998,1997,1996,1995,1994,1993,1992,1991,1990,1989,1988,1987,1986,1985,1984,1983,1982,1981,1980,1979,1978,1977,1976,1975,1974,1973,1972
This statistics in other country:
AlbaniaAlgeriaAngolaArab WorldArgentinaArmeniaAustraliaAustriaAzerbaijanBahrainBangladeshBelarusBelgiumBeninBoliviaBosnia and HerzegovinaBotswanaBrazilBrunei DarussalamBulgariaCambodiaCameroonCanadaCentral Europe and the BalticsChileChinaColombiaCongo, Dem. Rep.Congo, Rep.Costa RicaCote d'IvoireCroatiaCubaCuracaoCyprusCzech RepublicDenmarkDominican RepublicEarly-demographic dividendEast Asia & PacificEast Asia & Pacific (excluding high income)East Asia & Pacific (IDA & IBRD countries)EcuadorEgypt, Arab Rep.El SalvadorEritreaEstoniaEthiopiaEuro areaEurope & Central AsiaEurope & Central Asia (excluding high income)Europe & Central Asia (IDA & IBRD countries)European UnionFinlandFragile and conflict affected situationsFranceGabonGeorgiaGermanyGhanaGibraltarGreeceGuatemalaHaitiHeavily indebted poor countries (HIPC)High incomeHondurasHong Kong SAR, ChinaHungaryIBRD onlyIcelandIDA & IBRD totalIDA blendIDA onlyIDA totalIndiaIndonesiaIran, Islamic Rep.IraqIrelandIsraelItalyJamaicaJapanJordanKazakhstanKenyaKorea, Dem. People’s Rep.Korea, Rep.KosovoKuwaitKyrgyz RepublicLate-demographic dividendLatin America & Caribbean Latin America & Caribbean (excluding high income)Latin America & the Caribbean (IDA & IBRD countries)LatviaLeast developed countries: UN classificationLebanonLibyaLithuaniaLow & middle incomeLower middle incomeLuxembourgMacedonia, FYRMalaysiaMaltaMauritiusMexicoMiddle East & North AfricaMiddle East & North Africa (excluding high income)Middle East & North Africa (IDA & IBRD countries)Middle incomeMoldovaMongoliaMontenegroMoroccoMozambiqueMyanmarNamibiaNepalNetherlandsNew ZealandNicaraguaNigerNigeriaNorth AmericaNorwayOECD membersOmanOther small statesPakistanPanamaParaguayPeruPhilippinesPolandPortugalPost-demographic dividendPre-demographic dividendQatarRomaniaRussian FederationSaudi ArabiaSenegalSerbiaSingaporeSlovak RepublicSloveniaSmall statesSouth AfricaSouth AsiaSouth Asia (IDA & IBRD)South SudanSpainSri LankaSub-Saharan Africa Sub-Saharan Africa (excluding high income)Sub-Saharan Africa (IDA & IBRD countries)SudanSwedenSwitzerlandSyrian Arab RepublicTajikistanTanzaniaThailandTogoTrinidad and TobagoTunisiaTurkeyTurkmenistanUkraineUnited Arab EmiratesUnited KingdomUnited StatesUpper middle incomeUruguayUzbekistanVenezuela, RBVietnamWorldYemen, Rep.ZambiaZimbabwe Timeline:
This timeline shows a graph from 1972 to 2014 of Malaysia. No data until 1971. Number of actual observations by date: 43.
Source name:
World Development Indicators
Source organization:
IEA Statistics © OECD/IEA 2014 (http://www.iea.org/stats/index.asp), subject to https://www.iea.org/t&c/termsandconditions/
Categories, topics:
Energy & Mining, Climate Change, Infrastructure
Last updated:
apr 23, 2017
Indicators value changes by year
Maximum:
73.981
jan 1, 2000
At the date of observation
Value
Absolute change
Change from previous value
jan 1, 1979
1.029
+1.029
%
jan 1, 1980
1.068
+0.039
3.76%
jan 1, 1981
1.333
+0.265
24.86%
jan 1, 1982
1.362
+0.029
2.14%
jan 1, 1983
1.205
-0.157
-11.51%
jan 1, 1984
1.881
+0.676
56.08%
jan 1, 1985
2.401
+0.52
27.62%
jan 1, 1986
14.681
+12.281
511.55%
jan 1, 1987
17.742
+3.061
20.85%
jan 1, 1988
19.115
+1.373
7.74%
jan 1, 1989
20.825
+1.71
8.95%
jan 1, 1990
18.996
-1.829
-8.78%
jan 1, 1991
24.07
+5.074
26.71%
jan 1, 1992
29.098
+5.027
20.89%
jan 1, 1993
40.332
+11.235
38.61%
jan 1, 1994
49.457
+9.125
22.63%
jan 1, 1995
53.136
+3.678
7.44%
jan 1, 1996
58.986
+5.85
11.01%
jan 1, 1997
63.558
+4.573
7.75%
jan 1, 1998
70.133
+6.575
10.34%
jan 1, 1999
70.111
-0.022
-0.03%
jan 1, 2000
73.981
+3.87
5.52%
jan 1, 2001
73.638
-0.343
-0.46%
jan 1, 2002
71.421
-2.217
-3.01%
jan 1, 2003
67.424
-3.997
-5.6%
jan 1, 2004
70.903
+3.479
5.16%
jan 1, 2005
66.526
-4.377
-6.17%
jan 1, 2006
66.874
+0.349
0.52%
jan 1, 2007
66.271
-0.604
-0.9%
jan 1, 2008
63.349
-2.922
-4.41%
jan 1, 2009
63.839
+0.49
0.77%
jan 1, 2010
61.242
-2.597
-4.07%
jan 1, 2011
56.733
-4.508
-7.36%
jan 1, 2012
44.988
-11.745
-20.7%
jan 1, 2013
46.62
+1.633
3.63%
jan 1, 2014
48.979
+2.358
5.06%
Ranking of countries by current statistics by years


Comments: