29
/
en
AIzaSyAYiBZKx7MnpbEhh9jyipgxe19OcubqV5w
April 1, 2024
134003
France
FRA
true
2
1
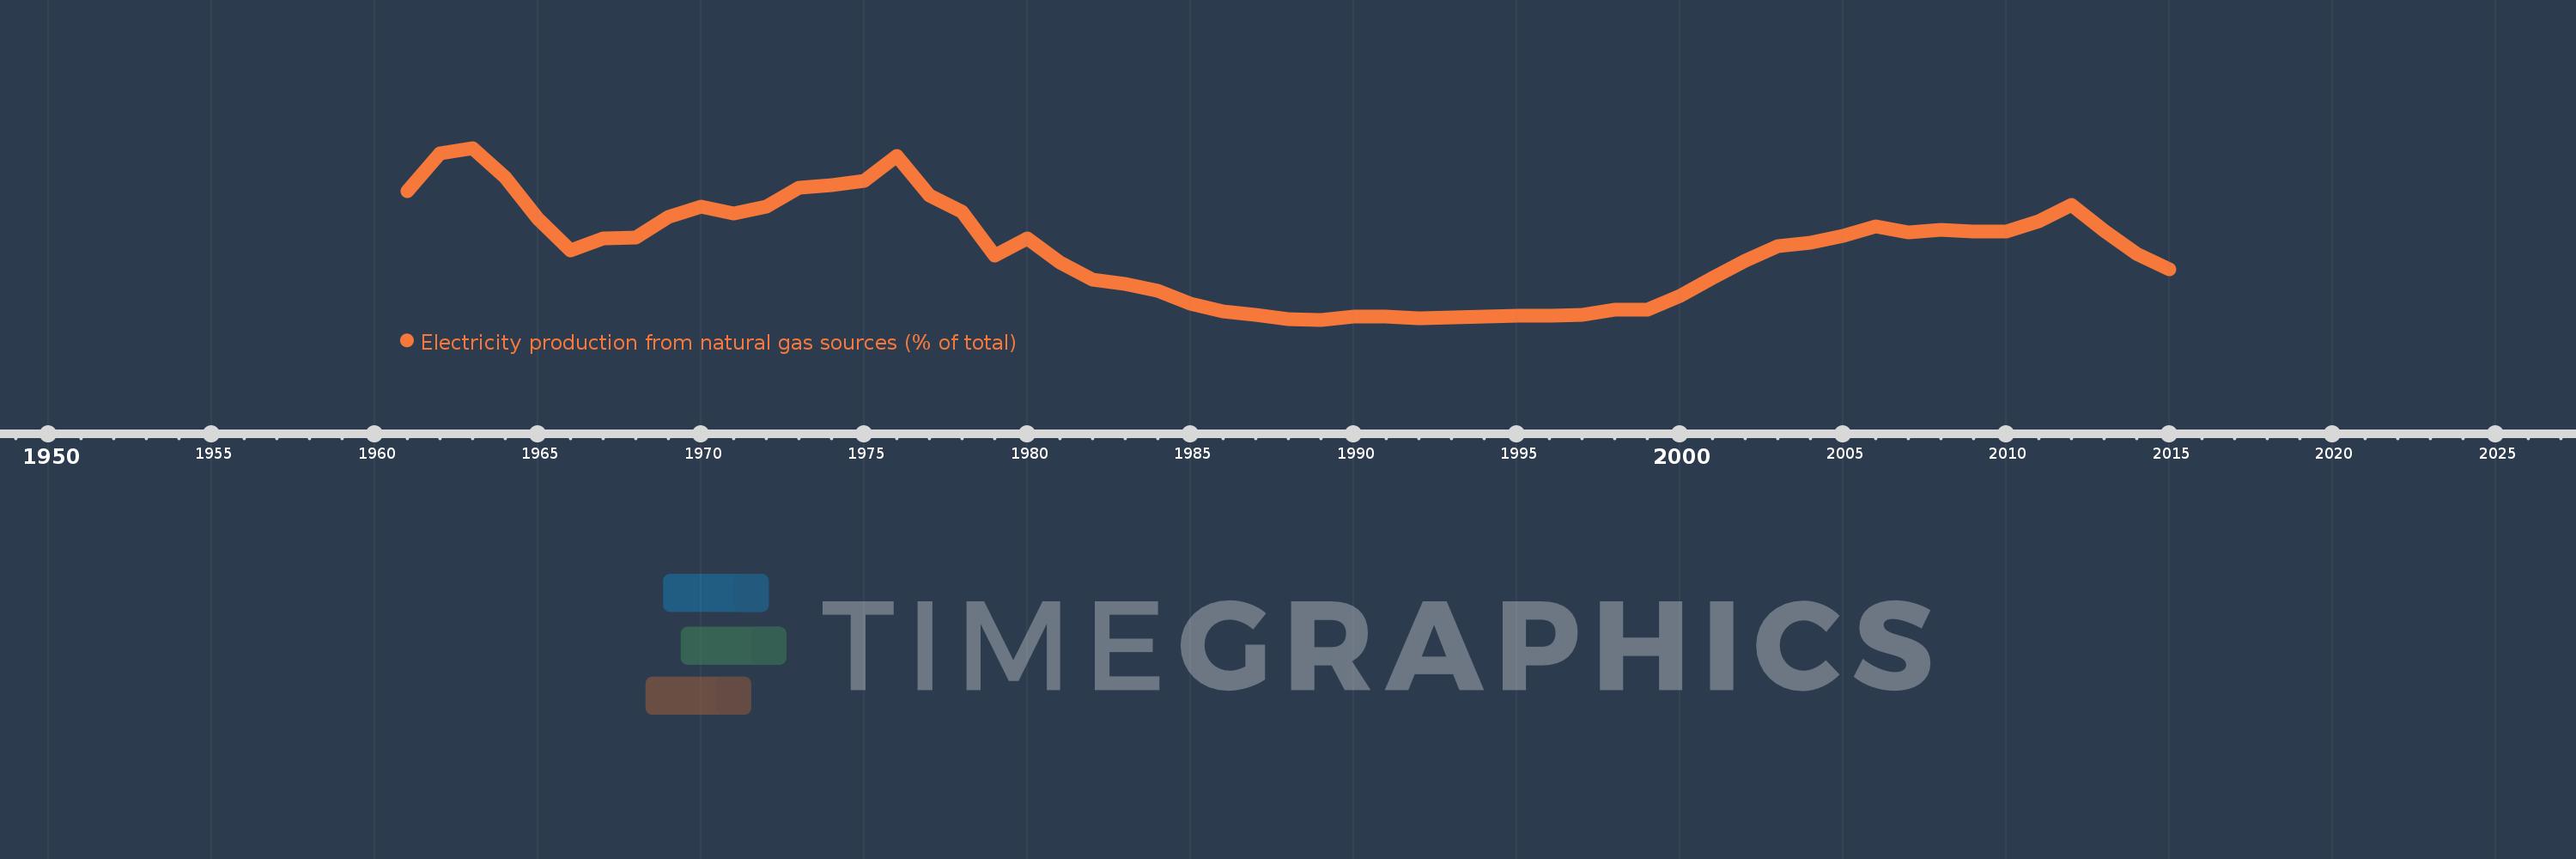
Electricity production from natural gas sources (% of total)
2015,2014,2013,2012,2011,2010,2009,2008,2007,2006,2005,2004,2003,2002,2001,2000,1999,1998,1997,1996,1995,1994,1993,1992,1991,1990,1989,1988,1987,1986,1985,1984,1983,1982,1981,1980,1979,1978,1977,1976,1975,1974,1973,1972,1971,1970,1969,1968,1967,1966,1965,1964,1963,1962,1961
This statistics in other country:
AlbaniaAlgeriaAngolaArab WorldArgentinaArmeniaAustraliaAustriaAzerbaijanBahrainBangladeshBelarusBelgiumBeninBoliviaBosnia and HerzegovinaBotswanaBrazilBrunei DarussalamBulgariaCambodiaCameroonCanadaCentral Europe and the BalticsChileChinaColombiaCongo, Dem. Rep.Congo, Rep.Costa RicaCote d'IvoireCroatiaCubaCuracaoCyprusCzech RepublicDenmarkDominican RepublicEarly-demographic dividendEast Asia & PacificEast Asia & Pacific (excluding high income)East Asia & Pacific (IDA & IBRD countries)EcuadorEgypt, Arab Rep.El SalvadorEritreaEstoniaEthiopiaEuro areaEurope & Central AsiaEurope & Central Asia (excluding high income)Europe & Central Asia (IDA & IBRD countries)European UnionFinlandFragile and conflict affected situationsFranceGabonGeorgiaGermanyGhanaGibraltarGreeceGuatemalaHaitiHeavily indebted poor countries (HIPC)High incomeHondurasHong Kong SAR, ChinaHungaryIBRD onlyIcelandIDA & IBRD totalIDA blendIDA onlyIDA totalIndiaIndonesiaIran, Islamic Rep.IraqIrelandIsraelItalyJamaicaJapanJordanKazakhstanKenyaKorea, Dem. People’s Rep.Korea, Rep.KosovoKuwaitKyrgyz RepublicLate-demographic dividendLatin America & Caribbean Latin America & Caribbean (excluding high income)Latin America & the Caribbean (IDA & IBRD countries)LatviaLeast developed countries: UN classificationLebanonLibyaLithuaniaLow & middle incomeLower middle incomeLuxembourgMacedonia, FYRMalaysiaMaltaMauritiusMexicoMiddle East & North AfricaMiddle East & North Africa (excluding high income)Middle East & North Africa (IDA & IBRD countries)Middle incomeMoldovaMongoliaMontenegroMoroccoMozambiqueMyanmarNamibiaNepalNetherlandsNew ZealandNicaraguaNigerNigeriaNorth AmericaNorwayOECD membersOmanOther small statesPakistanPanamaParaguayPeruPhilippinesPolandPortugalPost-demographic dividendPre-demographic dividendQatarRomaniaRussian FederationSaudi ArabiaSenegalSerbiaSingaporeSlovak RepublicSloveniaSmall statesSouth AfricaSouth AsiaSouth Asia (IDA & IBRD)South SudanSpainSri LankaSub-Saharan Africa Sub-Saharan Africa (excluding high income)Sub-Saharan Africa (IDA & IBRD countries)SudanSwedenSwitzerlandSyrian Arab RepublicTajikistanTanzaniaThailandTogoTrinidad and TobagoTunisiaTurkeyTurkmenistanUkraineUnited Arab EmiratesUnited KingdomUnited StatesUpper middle incomeUruguayUzbekistanVenezuela, RBVietnamWorldYemen, Rep.ZambiaZimbabwe Timeline:
This timeline shows a graph from 1961 to 2015 of France. No data until 1960. Number of actual observations by date: 55.
Source name:
World Development Indicators
Source organization:
IEA Statistics © OECD/IEA 2014 (http://www.iea.org/stats/index.asp), subject to https://www.iea.org/t&c/termsandconditions/
Categories, topics:
Energy & Mining, Climate Change, Infrastructure
Last updated:
apr 23, 2017
Indicators value changes by year
At the date of observation
Value
Absolute change
Change from previous value
jan 1, 1961
5.316
+5.316
0.0%
jan 1, 1962
6.712
+1.396
26.27%
jan 1, 1963
6.905
+0.193
2.87%
jan 1, 1964
5.835
-1.07
-15.5%
jan 1, 1965
4.318
-1.516
-25.99%
jan 1, 1966
3.17
-1.148
-26.59%
jan 1, 1967
3.601
+0.431
13.58%
jan 1, 1968
3.621
+0.021
0.58%
jan 1, 1969
4.387
+0.765
21.14%
jan 1, 1970
4.757
+0.37
8.44%
jan 1, 1971
4.497
-0.26
-5.46%
jan 1, 1972
4.753
+0.256
5.69%
jan 1, 1973
5.436
+0.682
14.36%
jan 1, 1974
5.529
+0.093
1.71%
jan 1, 1975
5.691
+0.163
2.94%
jan 1, 1976
6.597
+0.906
15.92%
jan 1, 1977
5.158
-1.439
-21.81%
jan 1, 1978
4.562
-0.596
-11.56%
jan 1, 1979
2.976
-1.586
-34.76%
jan 1, 1980
3.61
+0.634
21.3%
jan 1, 1981
2.723
-0.888
-24.59%
jan 1, 1982
2.09
-0.633
-23.25%
jan 1, 1983
1.922
-0.167
-8.01%
jan 1, 1984
1.67
-0.252
-13.13%
jan 1, 1985
1.214
-0.456
-27.28%
jan 1, 1986
0.92
-0.294
-24.2%
jan 1, 1987
0.79
-0.13
-14.13%
jan 1, 1988
0.647
-0.143
-18.13%
jan 1, 1989
0.619
-0.029
-4.41%
jan 1, 1990
0.737
+0.118
19.14%
jan 1, 1991
0.726
-0.011
-1.55%
jan 1, 1992
0.676
-0.049
-6.8%
jan 1, 1993
0.692
+0.016
2.39%
jan 1, 1994
0.744
+0.052
7.51%
jan 1, 1995
0.764
+0.019
2.61%
jan 1, 1996
0.782
+0.018
2.35%
jan 1, 1997
0.81
+0.028
3.56%
jan 1, 1998
0.978
+0.169
20.82%
jan 1, 1999
0.981
+0.003
0.27%
jan 1, 2000
1.477
+0.497
50.64%
jan 1, 2001
2.151
+0.674
45.61%
jan 1, 2002
2.778
+0.626
29.11%
jan 1, 2003
3.318
+0.54
19.45%
jan 1, 2004
3.449
+0.131
3.96%
jan 1, 2005
3.701
+0.252
7.3%
jan 1, 2006
4.037
+0.336
9.08%
jan 1, 2007
3.82
-0.217
-5.38%
jan 1, 2008
3.898
+0.077
2.03%
jan 1, 2009
3.846
-0.051
-1.32%
jan 1, 2010
3.862
+0.016
0.42%
jan 1, 2011
4.209
+0.347
8.98%
jan 1, 2012
4.808
+0.599
14.24%
jan 1, 2013
3.89
-0.919
-19.11%
jan 1, 2014
3.027
-0.863
-22.18%
jan 1, 2015
2.465
-0.561
-18.55%
Ranking of countries by current statistics by years


Comments: