29
/
en
AIzaSyAYiBZKx7MnpbEhh9jyipgxe19OcubqV5w
April 1, 2024
52521
OECD members
OED
false
2
1
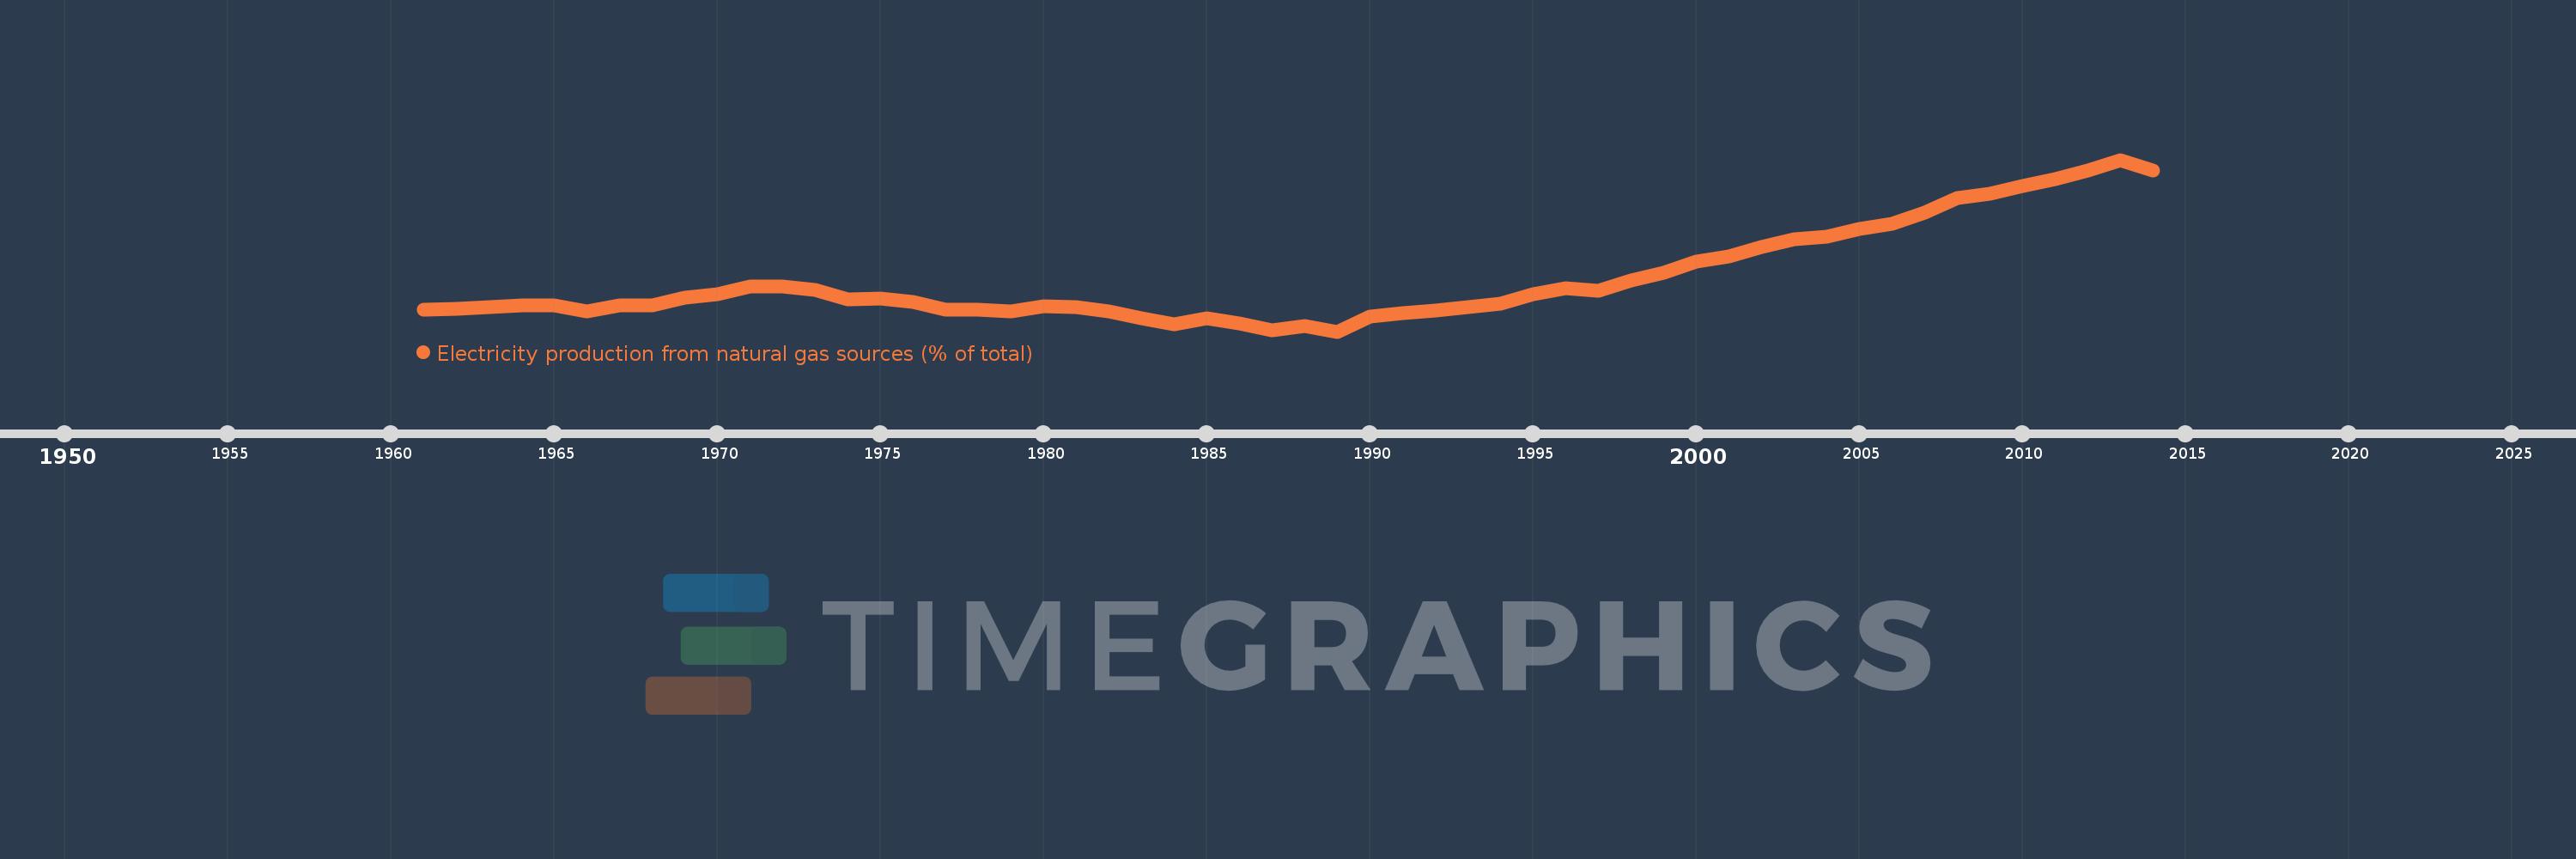
Electricity production from natural gas sources (% of total)
2014,2013,2012,2011,2010,2009,2008,2007,2006,2005,2004,2003,2002,2001,2000,1999,1998,1997,1996,1995,1994,1993,1992,1991,1990,1989,1988,1987,1986,1985,1984,1983,1982,1981,1980,1979,1978,1977,1976,1975,1974,1973,1972,1971,1970,1969,1968,1967,1966,1965,1964,1963,1962,1961
This statistics in other country:
AlbaniaAlgeriaAngolaArab WorldArgentinaArmeniaAustraliaAustriaAzerbaijanBahrainBangladeshBelarusBelgiumBeninBoliviaBosnia and HerzegovinaBotswanaBrazilBrunei DarussalamBulgariaCambodiaCameroonCanadaCentral Europe and the BalticsChileChinaColombiaCongo, Dem. Rep.Congo, Rep.Costa RicaCote d'IvoireCroatiaCubaCuracaoCyprusCzech RepublicDenmarkDominican RepublicEarly-demographic dividendEast Asia & PacificEast Asia & Pacific (excluding high income)East Asia & Pacific (IDA & IBRD countries)EcuadorEgypt, Arab Rep.El SalvadorEritreaEstoniaEthiopiaEuro areaEurope & Central AsiaEurope & Central Asia (excluding high income)Europe & Central Asia (IDA & IBRD countries)European UnionFinlandFragile and conflict affected situationsFranceGabonGeorgiaGermanyGhanaGibraltarGreeceGuatemalaHaitiHeavily indebted poor countries (HIPC)High incomeHondurasHong Kong SAR, ChinaHungaryIBRD onlyIcelandIDA & IBRD totalIDA blendIDA onlyIDA totalIndiaIndonesiaIran, Islamic Rep.IraqIrelandIsraelItalyJamaicaJapanJordanKazakhstanKenyaKorea, Dem. People’s Rep.Korea, Rep.KosovoKuwaitKyrgyz RepublicLate-demographic dividendLatin America & Caribbean Latin America & Caribbean (excluding high income)Latin America & the Caribbean (IDA & IBRD countries)LatviaLeast developed countries: UN classificationLebanonLibyaLithuaniaLow & middle incomeLower middle incomeLuxembourgMacedonia, FYRMalaysiaMaltaMauritiusMexicoMiddle East & North AfricaMiddle East & North Africa (excluding high income)Middle East & North Africa (IDA & IBRD countries)Middle incomeMoldovaMongoliaMontenegroMoroccoMozambiqueMyanmarNamibiaNepalNetherlandsNew ZealandNicaraguaNigerNigeriaNorth AmericaNorwayOECD membersOmanOther small statesPakistanPanamaParaguayPeruPhilippinesPolandPortugalPost-demographic dividendPre-demographic dividendQatarRomaniaRussian FederationSaudi ArabiaSenegalSerbiaSingaporeSlovak RepublicSloveniaSmall statesSouth AfricaSouth AsiaSouth Asia (IDA & IBRD)South SudanSpainSri LankaSub-Saharan Africa Sub-Saharan Africa (excluding high income)Sub-Saharan Africa (IDA & IBRD countries)SudanSwedenSwitzerlandSyrian Arab RepublicTajikistanTanzaniaThailandTogoTrinidad and TobagoTunisiaTurkeyTurkmenistanUkraineUnited Arab EmiratesUnited KingdomUnited StatesUpper middle incomeUruguayUzbekistanVenezuela, RBVietnamWorldYemen, Rep.ZambiaZimbabwe Timeline:
This timeline shows a graph from 1961 to 2014 of OECD members. No data until 1960. Number of actual observations by date: 54.
Source name:
World Development Indicators
Source organization:
IEA Statistics © OECD/IEA 2014 (http://www.iea.org/stats/index.asp), subject to https://www.iea.org/t&c/termsandconditions/
Categories, topics:
Energy & Mining, Climate Change, Infrastructure
Last updated:
apr 23, 2017
Indicators value changes by year
Maximum:
25.477
jan 1, 2013
At the date of observation
Value
Absolute change
Change from previous value
jan 1, 1961
10.528
+10.528
0.0%
jan 1, 1962
10.672
+0.145
1.37%
jan 1, 1963
10.822
+0.15
1.4%
jan 1, 1964
10.965
+0.143
1.32%
jan 1, 1965
10.981
+0.016
0.15%
jan 1, 1966
10.389
-0.593
-5.4%
jan 1, 1967
10.998
+0.61
5.87%
jan 1, 1968
11.0
+0.002
0.02%
jan 1, 1969
11.805
+0.805
7.32%
jan 1, 1970
12.098
+0.292
2.48%
jan 1, 1971
12.835
+0.737
6.09%
jan 1, 1972
12.889
+0.054
0.42%
jan 1, 1973
12.564
-0.325
-2.52%
jan 1, 1974
11.581
-0.983
-7.82%
jan 1, 1975
11.69
+0.109
0.94%
jan 1, 1976
11.313
-0.377
-3.23%
jan 1, 1977
10.608
-0.705
-6.24%
jan 1, 1978
10.553
-0.055
-0.52%
jan 1, 1979
10.387
-0.166
-1.57%
jan 1, 1980
10.952
+0.565
5.44%
jan 1, 1981
10.848
-0.104
-0.95%
jan 1, 1982
10.371
-0.477
-4.4%
jan 1, 1983
9.734
-0.637
-6.14%
jan 1, 1984
9.077
-0.657
-6.75%
jan 1, 1985
9.735
+0.658
7.25%
jan 1, 1986
9.221
-0.514
-5.28%
jan 1, 1987
8.492
-0.729
-7.9%
jan 1, 1988
8.912
+0.42
4.95%
jan 1, 1989
8.39
-0.522
-5.86%
jan 1, 1990
9.865
+1.475
17.59%
jan 1, 1991
10.26
+0.395
4.0%
jan 1, 1992
10.508
+0.249
2.42%
jan 1, 1993
10.82
+0.311
2.96%
jan 1, 1994
11.154
+0.334
3.09%
jan 1, 1995
12.148
+0.994
8.91%
jan 1, 1996
12.691
+0.544
4.47%
jan 1, 1997
12.484
-0.207
-1.63%
jan 1, 1998
13.495
+1.011
8.1%
jan 1, 1999
14.275
+0.78
5.78%
jan 1, 2000
15.367
+1.092
7.65%
jan 1, 2001
15.863
+0.495
3.22%
jan 1, 2002
16.781
+0.919
5.79%
jan 1, 2003
17.569
+0.788
4.69%
jan 1, 2004
17.801
+0.232
1.32%
jan 1, 2005
18.571
+0.77
4.33%
jan 1, 2006
19.103
+0.531
2.86%
jan 1, 2007
20.213
+1.11
5.81%
jan 1, 2008
21.659
+1.446
7.15%
jan 1, 2009
22.141
+0.482
2.23%
jan 1, 2010
22.908
+0.766
3.46%
jan 1, 2011
23.514
+0.606
2.65%
jan 1, 2012
24.416
+0.902
3.84%
jan 1, 2013
25.477
+1.061
4.34%
jan 1, 2014
24.401
-1.075
-4.22%
Ranking of countries by current statistics by years


Comments: