29
/
en
AIzaSyAYiBZKx7MnpbEhh9jyipgxe19OcubqV5w
April 1, 2024
159300
Ireland
IRL
true
2
1
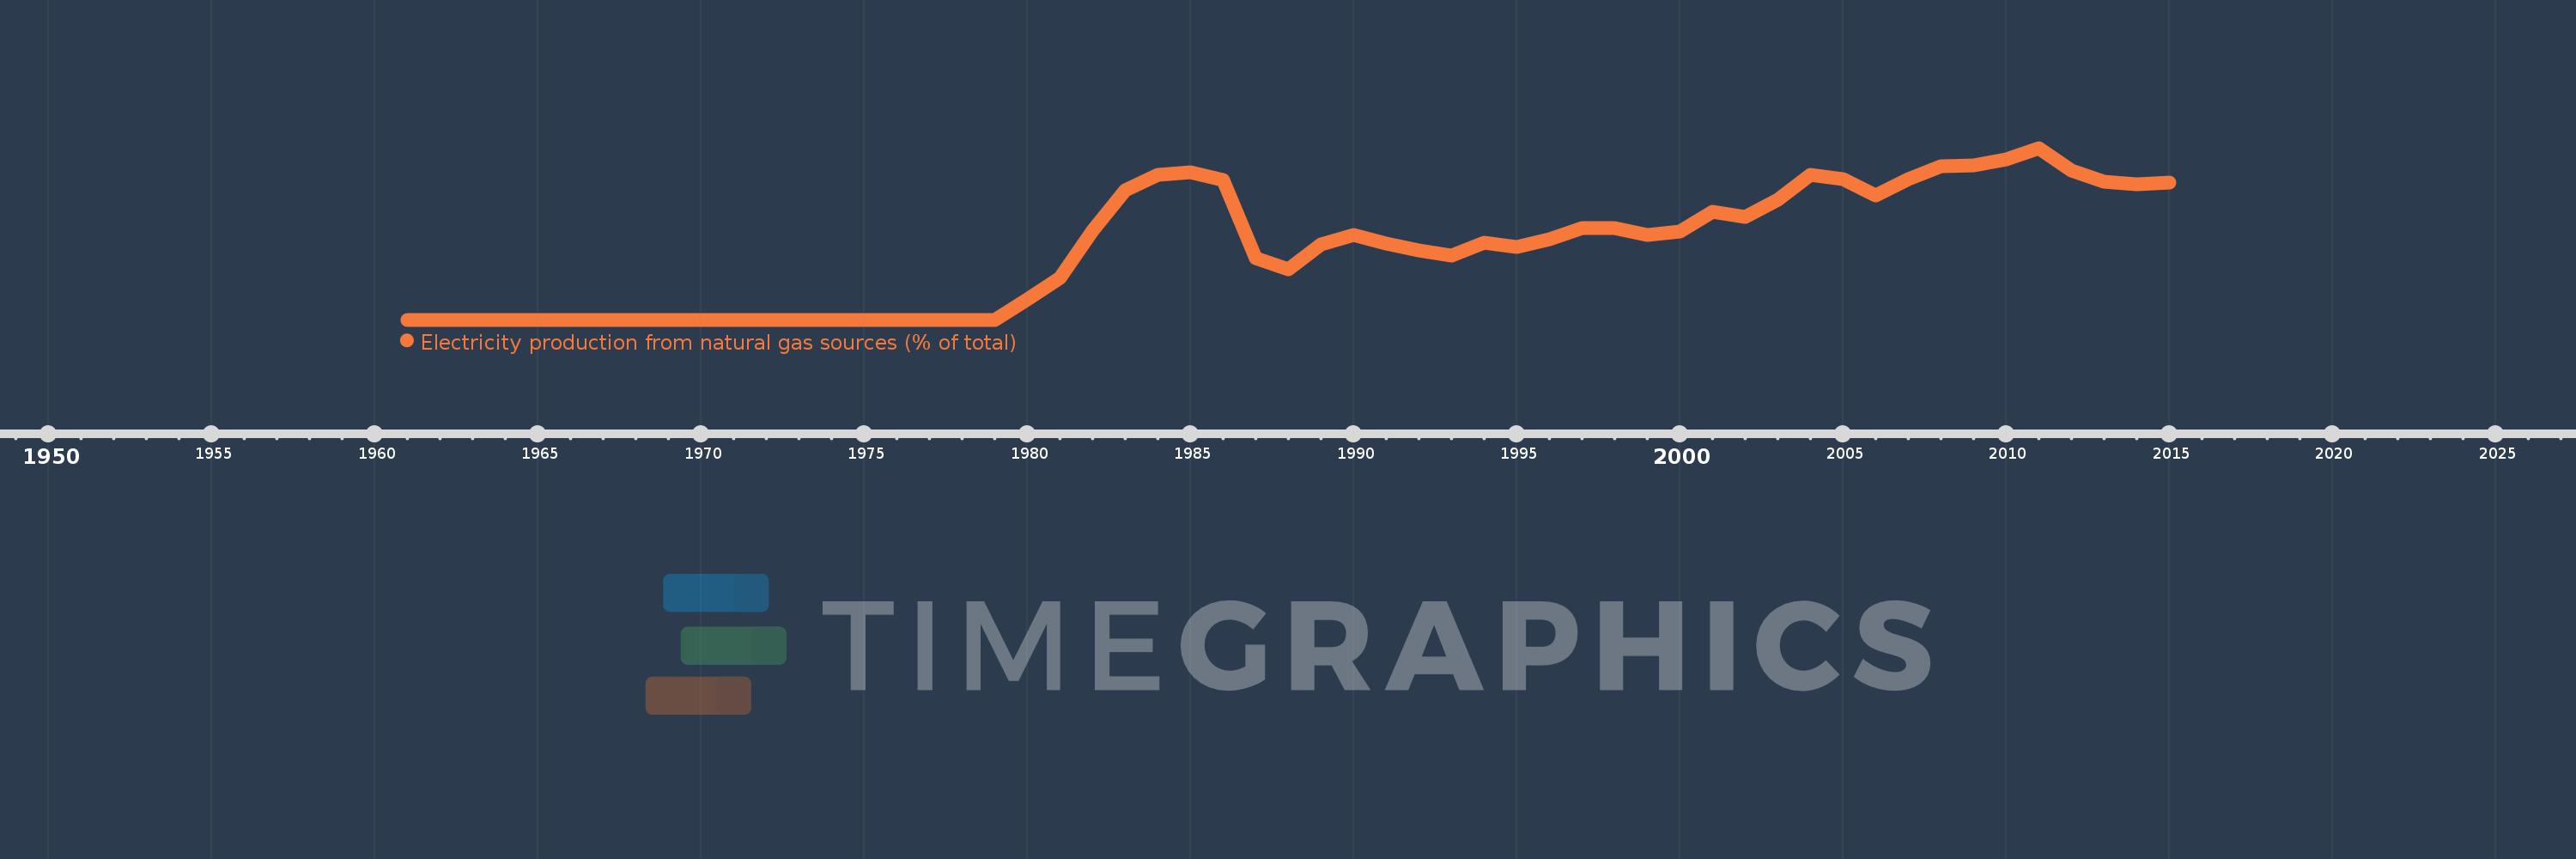
Electricity production from natural gas sources (% of total)
2015,2014,2013,2012,2011,2010,2009,2008,2007,2006,2005,2004,2003,2002,2001,2000,1999,1998,1997,1996,1995,1994,1993,1992,1991,1990,1989,1988,1987,1986,1985,1984,1983,1982,1981,1980,1979,1978,1977,1976,1975,1974,1973,1972,1971,1970,1969,1968,1967,1966,1965,1964,1963,1962,1961
This statistics in other country:
AlbaniaAlgeriaAngolaArab WorldArgentinaArmeniaAustraliaAustriaAzerbaijanBahrainBangladeshBelarusBelgiumBeninBoliviaBosnia and HerzegovinaBotswanaBrazilBrunei DarussalamBulgariaCambodiaCameroonCanadaCentral Europe and the BalticsChileChinaColombiaCongo, Dem. Rep.Congo, Rep.Costa RicaCote d'IvoireCroatiaCubaCuracaoCyprusCzech RepublicDenmarkDominican RepublicEarly-demographic dividendEast Asia & PacificEast Asia & Pacific (excluding high income)East Asia & Pacific (IDA & IBRD countries)EcuadorEgypt, Arab Rep.El SalvadorEritreaEstoniaEthiopiaEuro areaEurope & Central AsiaEurope & Central Asia (excluding high income)Europe & Central Asia (IDA & IBRD countries)European UnionFinlandFragile and conflict affected situationsFranceGabonGeorgiaGermanyGhanaGibraltarGreeceGuatemalaHaitiHeavily indebted poor countries (HIPC)High incomeHondurasHong Kong SAR, ChinaHungaryIBRD onlyIcelandIDA & IBRD totalIDA blendIDA onlyIDA totalIndiaIndonesiaIran, Islamic Rep.IraqIrelandIsraelItalyJamaicaJapanJordanKazakhstanKenyaKorea, Dem. People’s Rep.Korea, Rep.KosovoKuwaitKyrgyz RepublicLate-demographic dividendLatin America & Caribbean Latin America & Caribbean (excluding high income)Latin America & the Caribbean (IDA & IBRD countries)LatviaLeast developed countries: UN classificationLebanonLibyaLithuaniaLow & middle incomeLower middle incomeLuxembourgMacedonia, FYRMalaysiaMaltaMauritiusMexicoMiddle East & North AfricaMiddle East & North Africa (excluding high income)Middle East & North Africa (IDA & IBRD countries)Middle incomeMoldovaMongoliaMontenegroMoroccoMozambiqueMyanmarNamibiaNepalNetherlandsNew ZealandNicaraguaNigerNigeriaNorth AmericaNorwayOECD membersOmanOther small statesPakistanPanamaParaguayPeruPhilippinesPolandPortugalPost-demographic dividendPre-demographic dividendQatarRomaniaRussian FederationSaudi ArabiaSenegalSerbiaSingaporeSlovak RepublicSloveniaSmall statesSouth AfricaSouth AsiaSouth Asia (IDA & IBRD)South SudanSpainSri LankaSub-Saharan Africa Sub-Saharan Africa (excluding high income)Sub-Saharan Africa (IDA & IBRD countries)SudanSwedenSwitzerlandSyrian Arab RepublicTajikistanTanzaniaThailandTogoTrinidad and TobagoTunisiaTurkeyTurkmenistanUkraineUnited Arab EmiratesUnited KingdomUnited StatesUpper middle incomeUruguayUzbekistanVenezuela, RBVietnamWorldYemen, Rep.ZambiaZimbabwe Timeline:
This timeline shows a graph from 1961 to 2015 of Ireland. No data until 1960. Number of actual observations by date: 55.
Source name:
World Development Indicators
Source organization:
IEA Statistics © OECD/IEA 2014 (http://www.iea.org/stats/index.asp), subject to https://www.iea.org/t&c/termsandconditions/
Categories, topics:
Energy & Mining, Climate Change, Infrastructure
Last updated:
apr 23, 2017
Indicators value changes by year
Maximum:
62.287
jan 1, 2011
At the date of observation
Value
Absolute change
Change from previous value
jan 1, 1981
15.238
+7.897
107.59%
jan 1, 1982
32.282
+17.045
111.86%
jan 1, 1983
47.056
+14.774
45.76%
jan 1, 1984
52.643
+5.587
11.87%
jan 1, 1985
53.569
+0.926
1.76%
jan 1, 1986
50.762
-2.807
-5.24%
jan 1, 1987
22.483
-28.279
-55.71%
jan 1, 1988
18.283
-4.2
-18.68%
jan 1, 1989
27.359
+9.076
49.64%
jan 1, 1990
30.833
+3.474
12.7%
jan 1, 1991
27.697
-3.136
-10.17%
jan 1, 1992
25.131
-2.566
-9.27%
jan 1, 1993
23.118
-2.013
-8.01%
jan 1, 1994
28.082
+4.964
21.47%
jan 1, 1995
26.48
-1.603
-5.71%
jan 1, 1996
29.312
+2.832
10.69%
jan 1, 1997
33.251
+3.939
13.44%
jan 1, 1998
33.364
+0.113
0.34%
jan 1, 1999
30.774
-2.59
-7.76%
jan 1, 2000
31.969
+1.195
3.88%
jan 1, 2001
39.129
+7.16
22.4%
jan 1, 2002
37.135
-1.994
-5.1%
jan 1, 2003
43.59
+6.455
17.38%
jan 1, 2004
52.444
+8.854
20.31%
jan 1, 2005
51.136
-1.307
-2.49%
jan 1, 2006
45.165
-5.971
-11.68%
jan 1, 2007
50.837
+5.672
12.56%
jan 1, 2008
55.532
+4.694
9.23%
jan 1, 2009
55.905
+0.373
0.67%
jan 1, 2010
58.295
+2.39
4.27%
jan 1, 2011
62.287
+3.992
6.85%
jan 1, 2012
54.182
-8.104
-13.01%
jan 1, 2013
50.146
-4.036
-7.45%
jan 1, 2014
49.148
-0.998
-1.99%
jan 1, 2015
49.655
+0.507
1.03%
Ranking of countries by current statistics by years


Comments: