29
/
en
AIzaSyAYiBZKx7MnpbEhh9jyipgxe19OcubqV5w
April 1, 2024
269204
Turkey
TUR
true
2
1
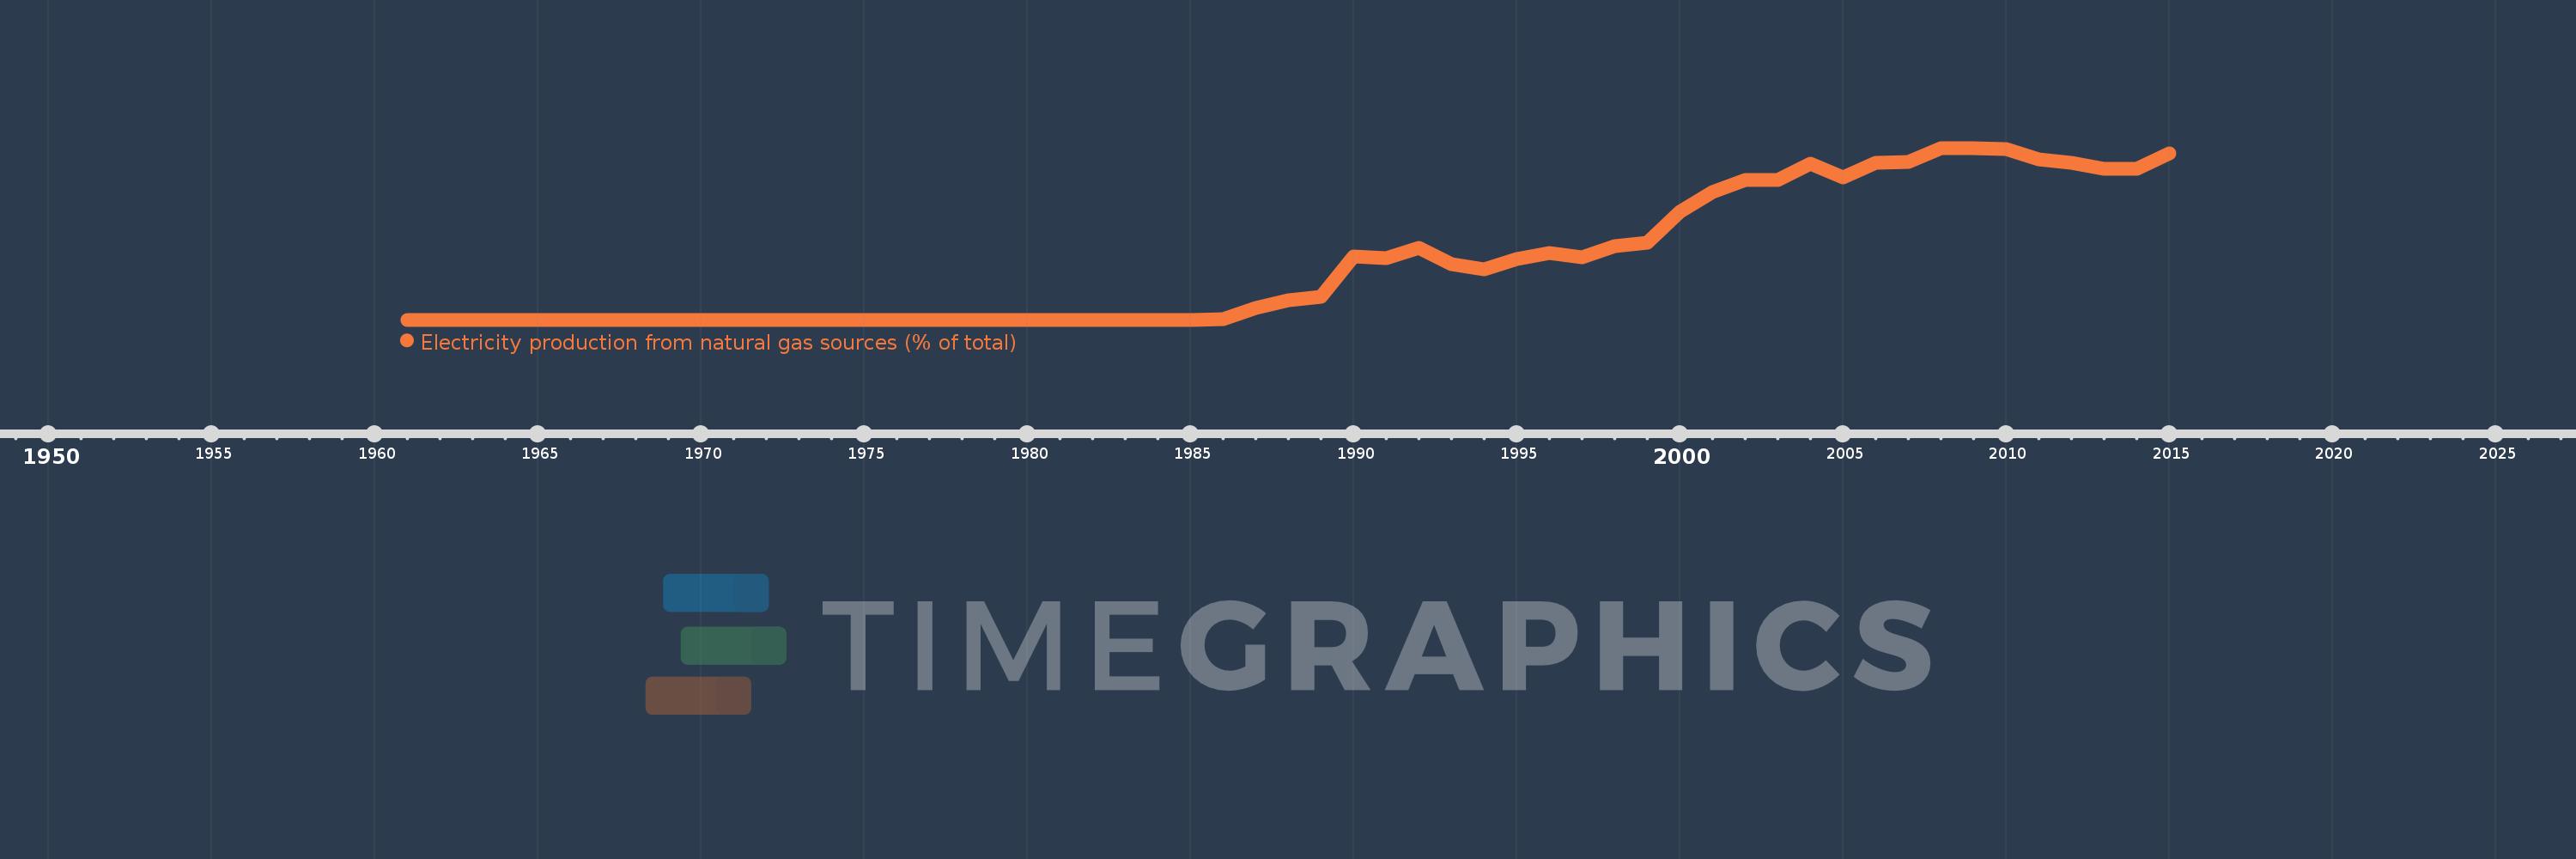
Electricity production from natural gas sources (% of total)
2015,2014,2013,2012,2011,2010,2009,2008,2007,2006,2005,2004,2003,2002,2001,2000,1999,1998,1997,1996,1995,1994,1993,1992,1991,1990,1989,1988,1987,1986,1985,1984,1983,1982,1981,1980,1979,1978,1977,1976,1975,1974,1973,1972,1971,1970,1969,1968,1967,1966,1965,1964,1963,1962,1961
This statistics in other country:
AlbaniaAlgeriaAngolaArab WorldArgentinaArmeniaAustraliaAustriaAzerbaijanBahrainBangladeshBelarusBelgiumBeninBoliviaBosnia and HerzegovinaBotswanaBrazilBrunei DarussalamBulgariaCambodiaCameroonCanadaCentral Europe and the BalticsChileChinaColombiaCongo, Dem. Rep.Congo, Rep.Costa RicaCote d'IvoireCroatiaCubaCuracaoCyprusCzech RepublicDenmarkDominican RepublicEarly-demographic dividendEast Asia & PacificEast Asia & Pacific (excluding high income)East Asia & Pacific (IDA & IBRD countries)EcuadorEgypt, Arab Rep.El SalvadorEritreaEstoniaEthiopiaEuro areaEurope & Central AsiaEurope & Central Asia (excluding high income)Europe & Central Asia (IDA & IBRD countries)European UnionFinlandFragile and conflict affected situationsFranceGabonGeorgiaGermanyGhanaGibraltarGreeceGuatemalaHaitiHeavily indebted poor countries (HIPC)High incomeHondurasHong Kong SAR, ChinaHungaryIBRD onlyIcelandIDA & IBRD totalIDA blendIDA onlyIDA totalIndiaIndonesiaIran, Islamic Rep.IraqIrelandIsraelItalyJamaicaJapanJordanKazakhstanKenyaKorea, Dem. People’s Rep.Korea, Rep.KosovoKuwaitKyrgyz RepublicLate-demographic dividendLatin America & Caribbean Latin America & Caribbean (excluding high income)Latin America & the Caribbean (IDA & IBRD countries)LatviaLeast developed countries: UN classificationLebanonLibyaLithuaniaLow & middle incomeLower middle incomeLuxembourgMacedonia, FYRMalaysiaMaltaMauritiusMexicoMiddle East & North AfricaMiddle East & North Africa (excluding high income)Middle East & North Africa (IDA & IBRD countries)Middle incomeMoldovaMongoliaMontenegroMoroccoMozambiqueMyanmarNamibiaNepalNetherlandsNew ZealandNicaraguaNigerNigeriaNorth AmericaNorwayOECD membersOmanOther small statesPakistanPanamaParaguayPeruPhilippinesPolandPortugalPost-demographic dividendPre-demographic dividendQatarRomaniaRussian FederationSaudi ArabiaSenegalSerbiaSingaporeSlovak RepublicSloveniaSmall statesSouth AfricaSouth AsiaSouth Asia (IDA & IBRD)South SudanSpainSri LankaSub-Saharan Africa Sub-Saharan Africa (excluding high income)Sub-Saharan Africa (IDA & IBRD countries)SudanSwedenSwitzerlandSyrian Arab RepublicTajikistanTanzaniaThailandTogoTrinidad and TobagoTunisiaTurkeyTurkmenistanUkraineUnited Arab EmiratesUnited KingdomUnited StatesUpper middle incomeUruguayUzbekistanVenezuela, RBVietnamWorldYemen, Rep.ZambiaZimbabwe Timeline:
This timeline shows a graph from 1961 to 2015 of Turkey. No data until 1960. Number of actual observations by date: 55.
Source name:
World Development Indicators
Source organization:
IEA Statistics © OECD/IEA 2014 (http://www.iea.org/stats/index.asp), subject to https://www.iea.org/t&c/termsandconditions/
Categories, topics:
Energy & Mining, Climate Change, Infrastructure
Last updated:
apr 23, 2017
Indicators value changes by year
Maximum:
49.736
jan 1, 2009
At the date of observation
Value
Absolute change
Change from previous value
jan 1, 1986
0.169
+0.169
%
jan 1, 1987
3.378
+3.209
1.89K%
jan 1, 1988
5.7
+2.321
68.72%
jan 1, 1989
6.743
+1.044
18.31%
jan 1, 1990
18.3
+11.557
171.38%
jan 1, 1991
17.712
-0.588
-3.21%
jan 1, 1992
20.896
+3.184
17.98%
jan 1, 1993
16.057
-4.839
-23.16%
jan 1, 1994
14.616
-1.441
-8.97%
jan 1, 1995
17.648
+3.032
20.74%
jan 1, 1996
19.223
+1.575
8.92%
jan 1, 1997
18.104
-1.119
-5.82%
jan 1, 1998
21.381
+3.277
18.1%
jan 1, 1999
22.384
+1.003
4.69%
jan 1, 2000
31.276
+8.892
39.73%
jan 1, 2001
36.996
+5.72
18.29%
jan 1, 2002
40.375
+3.379
9.13%
jan 1, 2003
40.57
+0.195
0.48%
jan 1, 2004
45.195
+4.626
11.4%
jan 1, 2005
41.302
-3.893
-8.61%
jan 1, 2006
45.349
+4.047
9.8%
jan 1, 2007
45.769
+0.421
0.93%
jan 1, 2008
49.606
+3.837
8.38%
jan 1, 2009
49.736
+0.13
0.26%
jan 1, 2010
49.327
-0.409
-0.82%
jan 1, 2011
46.468
-2.859
-5.8%
jan 1, 2012
45.358
-1.11
-2.39%
jan 1, 2013
43.633
-1.725
-3.8%
jan 1, 2014
43.77
+0.137
0.31%
jan 1, 2015
48.092
+4.321
9.87%
Ranking of countries by current statistics by years


Comments: