29
/
en
AIzaSyAYiBZKx7MnpbEhh9jyipgxe19OcubqV5w
April 1, 2024
154473
India
IND
true
2
1
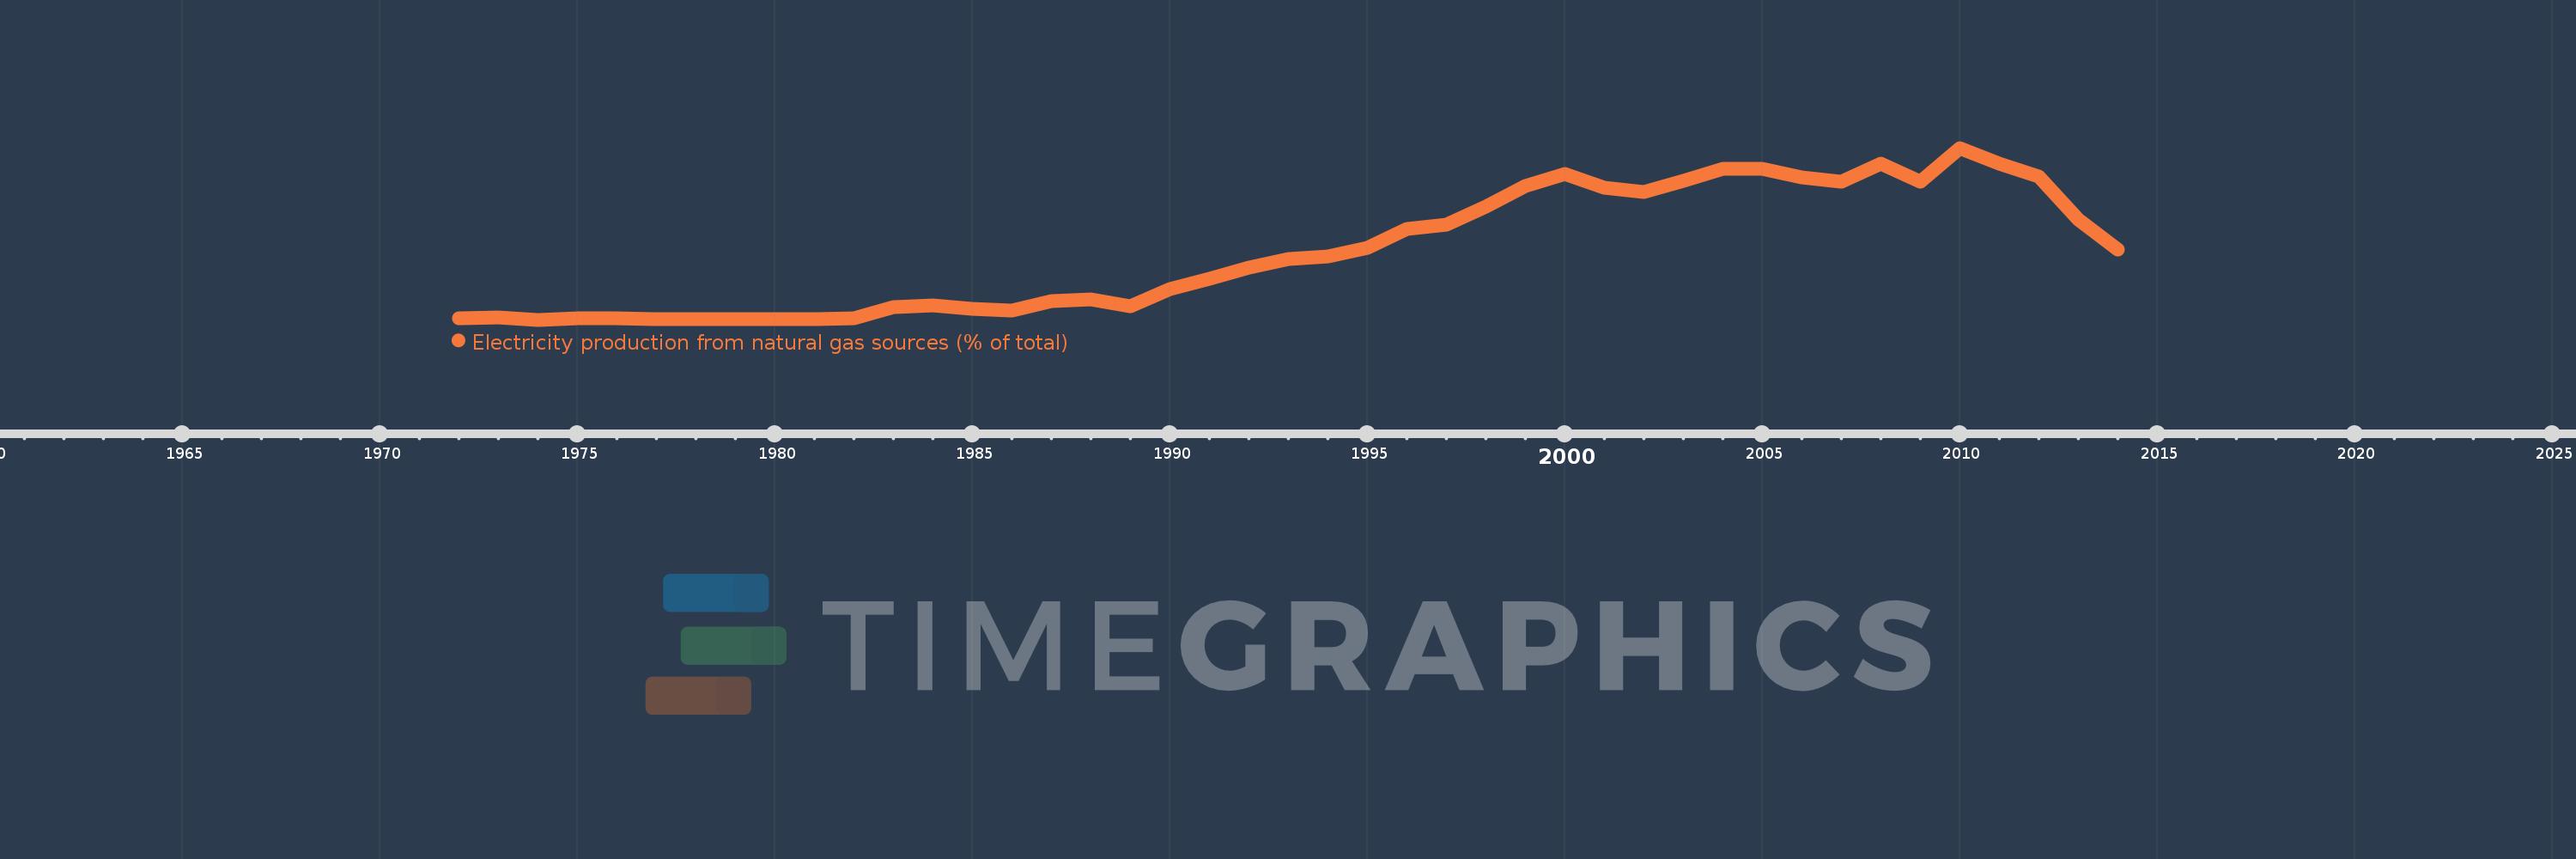
Electricity production from natural gas sources (% of total)
2014,2013,2012,2011,2010,2009,2008,2007,2006,2005,2004,2003,2002,2001,2000,1999,1998,1997,1996,1995,1994,1993,1992,1991,1990,1989,1988,1987,1986,1985,1984,1983,1982,1981,1980,1979,1978,1977,1976,1975,1974,1973,1972
This statistics in other country:
AlbaniaAlgeriaAngolaArab WorldArgentinaArmeniaAustraliaAustriaAzerbaijanBahrainBangladeshBelarusBelgiumBeninBoliviaBosnia and HerzegovinaBotswanaBrazilBrunei DarussalamBulgariaCambodiaCameroonCanadaCentral Europe and the BalticsChileChinaColombiaCongo, Dem. Rep.Congo, Rep.Costa RicaCote d'IvoireCroatiaCubaCuracaoCyprusCzech RepublicDenmarkDominican RepublicEarly-demographic dividendEast Asia & PacificEast Asia & Pacific (excluding high income)East Asia & Pacific (IDA & IBRD countries)EcuadorEgypt, Arab Rep.El SalvadorEritreaEstoniaEthiopiaEuro areaEurope & Central AsiaEurope & Central Asia (excluding high income)Europe & Central Asia (IDA & IBRD countries)European UnionFinlandFragile and conflict affected situationsFranceGabonGeorgiaGermanyGhanaGibraltarGreeceGuatemalaHaitiHeavily indebted poor countries (HIPC)High incomeHondurasHong Kong SAR, ChinaHungaryIBRD onlyIcelandIDA & IBRD totalIDA blendIDA onlyIDA totalIndiaIndonesiaIran, Islamic Rep.IraqIrelandIsraelItalyJamaicaJapanJordanKazakhstanKenyaKorea, Dem. People’s Rep.Korea, Rep.KosovoKuwaitKyrgyz RepublicLate-demographic dividendLatin America & Caribbean Latin America & Caribbean (excluding high income)Latin America & the Caribbean (IDA & IBRD countries)LatviaLeast developed countries: UN classificationLebanonLibyaLithuaniaLow & middle incomeLower middle incomeLuxembourgMacedonia, FYRMalaysiaMaltaMauritiusMexicoMiddle East & North AfricaMiddle East & North Africa (excluding high income)Middle East & North Africa (IDA & IBRD countries)Middle incomeMoldovaMongoliaMontenegroMoroccoMozambiqueMyanmarNamibiaNepalNetherlandsNew ZealandNicaraguaNigerNigeriaNorth AmericaNorwayOECD membersOmanOther small statesPakistanPanamaParaguayPeruPhilippinesPolandPortugalPost-demographic dividendPre-demographic dividendQatarRomaniaRussian FederationSaudi ArabiaSenegalSerbiaSingaporeSlovak RepublicSloveniaSmall statesSouth AfricaSouth AsiaSouth Asia (IDA & IBRD)South SudanSpainSri LankaSub-Saharan Africa Sub-Saharan Africa (excluding high income)Sub-Saharan Africa (IDA & IBRD countries)SudanSwedenSwitzerlandSyrian Arab RepublicTajikistanTanzaniaThailandTogoTrinidad and TobagoTunisiaTurkeyTurkmenistanUkraineUnited Arab EmiratesUnited KingdomUnited StatesUpper middle incomeUruguayUzbekistanVenezuela, RBVietnamWorldYemen, Rep.ZambiaZimbabwe Timeline:
This timeline shows a graph from 1972 to 2014 of India. No data until 1971. Number of actual observations by date: 43.
Source name:
World Development Indicators
Source organization:
IEA Statistics © OECD/IEA 2014 (http://www.iea.org/stats/index.asp), subject to https://www.iea.org/t&c/termsandconditions/
Categories, topics:
Energy & Mining, Climate Change, Infrastructure
Last updated:
apr 23, 2017
Indicators value changes by year
Maximum:
12.658
jan 1, 2010
At the date of observation
Value
Absolute change
Change from previous value
jan 1, 1972
0.568
+0.568
0.0%
jan 1, 1973
0.672
+0.104
18.36%
jan 1, 1974
0.492
-0.18
-26.84%
jan 1, 1975
0.606
+0.115
23.31%
jan 1, 1976
0.597
-0.009
-1.55%
jan 1, 1977
0.508
-0.089
-14.86%
jan 1, 1978
0.514
+0.005
1.03%
jan 1, 1979
0.512
-0.001
-0.27%
jan 1, 1980
0.524
+0.012
2.29%
jan 1, 1981
0.518
-0.006
-1.07%
jan 1, 1982
0.599
+0.081
15.63%
jan 1, 1983
1.404
+0.804
134.24%
jan 1, 1984
1.508
+0.104
7.41%
jan 1, 1985
1.251
-0.256
-17.0%
jan 1, 1986
1.16
-0.092
-7.33%
jan 1, 1987
1.805
+0.645
55.66%
jan 1, 1988
1.909
+0.103
5.73%
jan 1, 1989
1.475
-0.434
-22.71%
jan 1, 1990
2.676
+1.201
81.44%
jan 1, 1991
3.402
+0.725
27.1%
jan 1, 1992
4.183
+0.781
22.97%
jan 1, 1993
4.822
+0.639
15.27%
jan 1, 1994
4.954
+0.133
2.75%
jan 1, 1995
5.599
+0.645
13.01%
jan 1, 1996
6.948
+1.348
24.08%
jan 1, 1997
7.228
+0.281
4.04%
jan 1, 1998
8.5
+1.272
17.6%
jan 1, 1999
9.96
+1.46
17.18%
jan 1, 2000
10.812
+0.852
8.55%
jan 1, 2001
9.824
-0.988
-9.14%
jan 1, 2002
9.51
-0.314
-3.19%
jan 1, 2003
10.301
+0.791
8.31%
jan 1, 2004
11.186
+0.885
8.6%
jan 1, 2005
11.196
+0.01
0.09%
jan 1, 2006
10.545
-0.65
-5.81%
jan 1, 2007
10.257
-0.289
-2.74%
jan 1, 2008
11.572
+1.315
12.82%
jan 1, 2009
10.244
-1.328
-11.48%
jan 1, 2010
12.658
+2.414
23.57%
jan 1, 2011
11.567
-1.091
-8.62%
jan 1, 2012
10.627
-0.94
-8.12%
jan 1, 2013
7.613
-3.014
-28.36%
jan 1, 2014
5.455
-2.159
-28.35%
Ranking of countries by current statistics by years


Comments: