29
/
en
AIzaSyAYiBZKx7MnpbEhh9jyipgxe19OcubqV5w
April 1, 2024
181978
Luxembourg
LUX
true
2
1
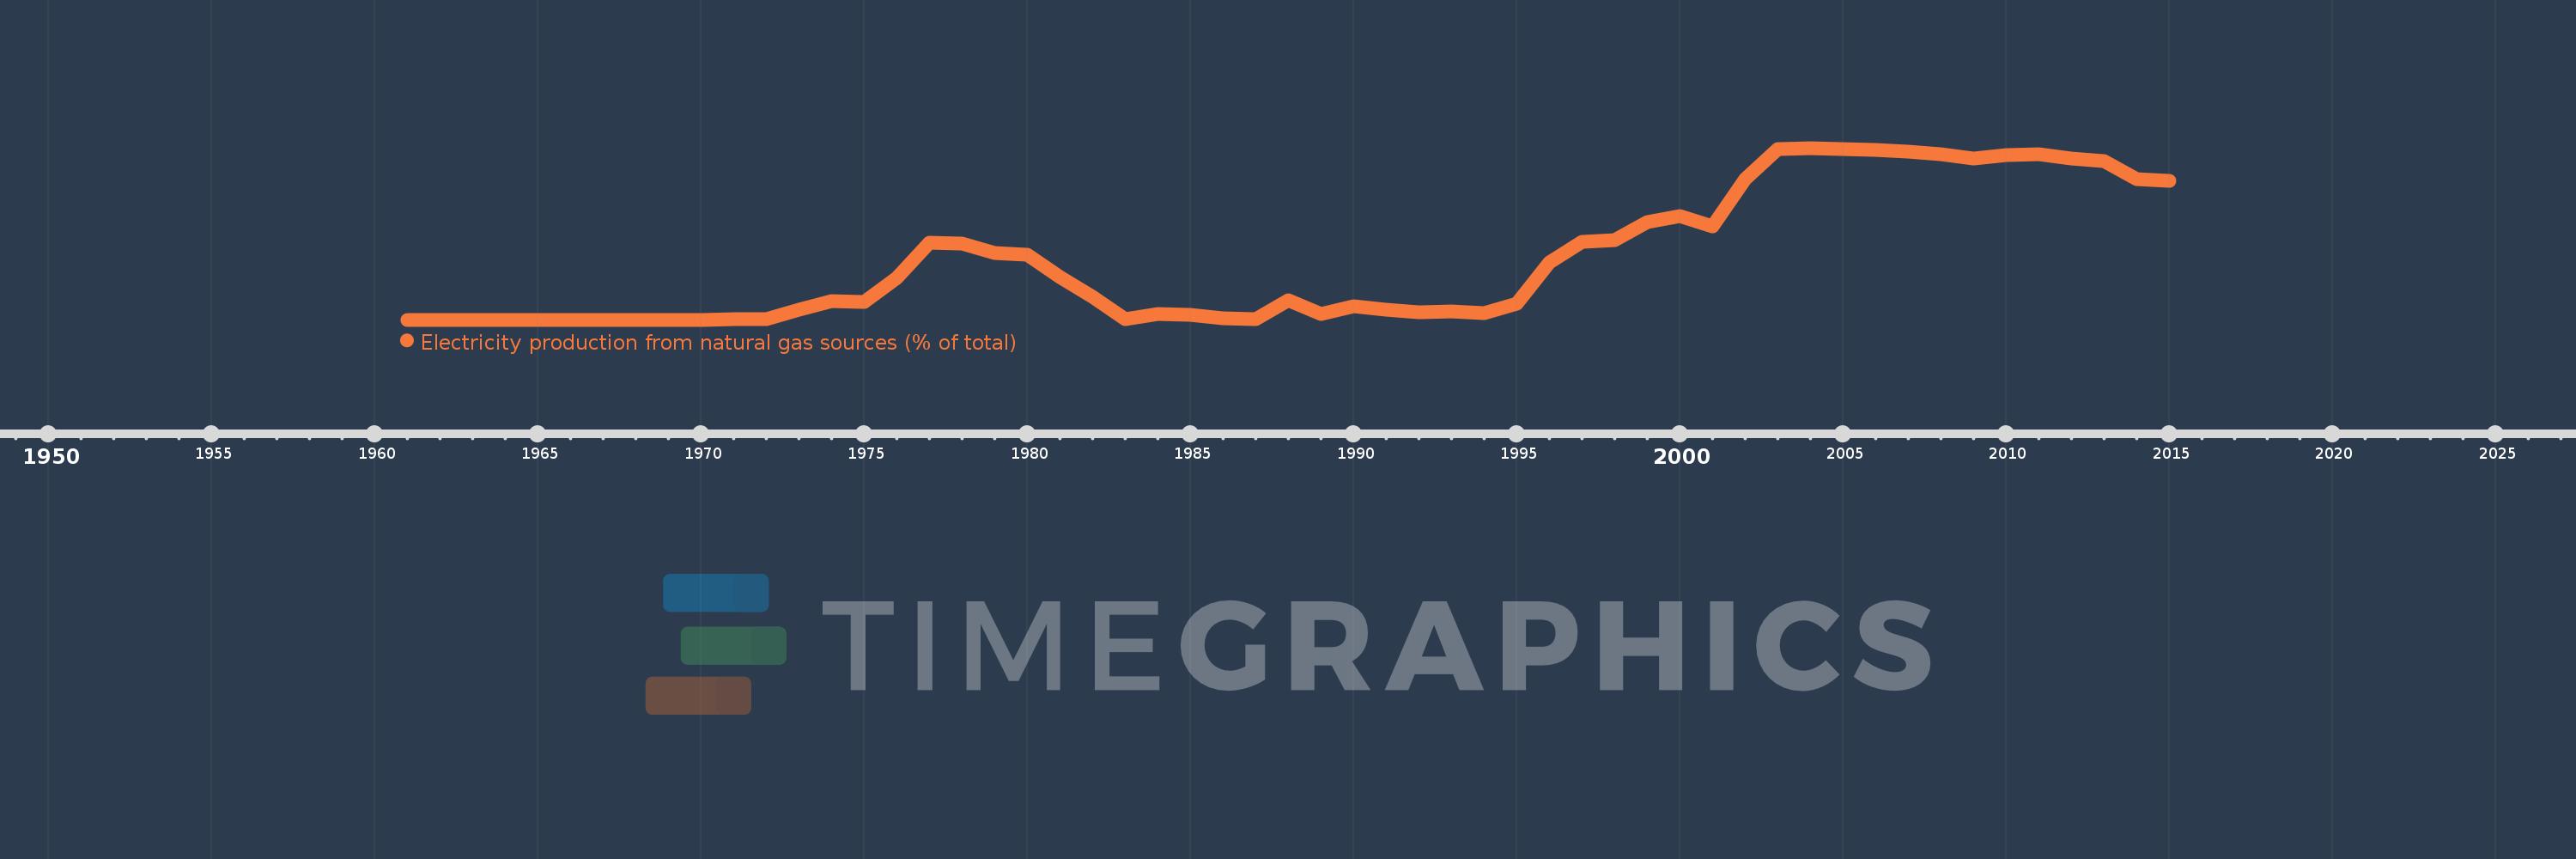
Electricity production from natural gas sources (% of total)
2015,2014,2013,2012,2011,2010,2009,2008,2007,2006,2005,2004,2003,2002,2001,2000,1999,1998,1997,1996,1995,1994,1993,1992,1991,1990,1989,1988,1987,1986,1985,1984,1983,1982,1981,1980,1979,1978,1977,1976,1975,1974,1973,1972,1971,1970,1969,1968,1967,1966,1965,1964,1963,1962,1961
This statistics in other country:
AlbaniaAlgeriaAngolaArab WorldArgentinaArmeniaAustraliaAustriaAzerbaijanBahrainBangladeshBelarusBelgiumBeninBoliviaBosnia and HerzegovinaBotswanaBrazilBrunei DarussalamBulgariaCambodiaCameroonCanadaCentral Europe and the BalticsChileChinaColombiaCongo, Dem. Rep.Congo, Rep.Costa RicaCote d'IvoireCroatiaCubaCuracaoCyprusCzech RepublicDenmarkDominican RepublicEarly-demographic dividendEast Asia & PacificEast Asia & Pacific (excluding high income)East Asia & Pacific (IDA & IBRD countries)EcuadorEgypt, Arab Rep.El SalvadorEritreaEstoniaEthiopiaEuro areaEurope & Central AsiaEurope & Central Asia (excluding high income)Europe & Central Asia (IDA & IBRD countries)European UnionFinlandFragile and conflict affected situationsFranceGabonGeorgiaGermanyGhanaGibraltarGreeceGuatemalaHaitiHeavily indebted poor countries (HIPC)High incomeHondurasHong Kong SAR, ChinaHungaryIBRD onlyIcelandIDA & IBRD totalIDA blendIDA onlyIDA totalIndiaIndonesiaIran, Islamic Rep.IraqIrelandIsraelItalyJamaicaJapanJordanKazakhstanKenyaKorea, Dem. People’s Rep.Korea, Rep.KosovoKuwaitKyrgyz RepublicLate-demographic dividendLatin America & Caribbean Latin America & Caribbean (excluding high income)Latin America & the Caribbean (IDA & IBRD countries)LatviaLeast developed countries: UN classificationLebanonLibyaLithuaniaLow & middle incomeLower middle incomeLuxembourgMacedonia, FYRMalaysiaMaltaMauritiusMexicoMiddle East & North AfricaMiddle East & North Africa (excluding high income)Middle East & North Africa (IDA & IBRD countries)Middle incomeMoldovaMongoliaMontenegroMoroccoMozambiqueMyanmarNamibiaNepalNetherlandsNew ZealandNicaraguaNigerNigeriaNorth AmericaNorwayOECD membersOmanOther small statesPakistanPanamaParaguayPeruPhilippinesPolandPortugalPost-demographic dividendPre-demographic dividendQatarRomaniaRussian FederationSaudi ArabiaSenegalSerbiaSingaporeSlovak RepublicSloveniaSmall statesSouth AfricaSouth AsiaSouth Asia (IDA & IBRD)South SudanSpainSri LankaSub-Saharan Africa Sub-Saharan Africa (excluding high income)Sub-Saharan Africa (IDA & IBRD countries)SudanSwedenSwitzerlandSyrian Arab RepublicTajikistanTanzaniaThailandTogoTrinidad and TobagoTunisiaTurkeyTurkmenistanUkraineUnited Arab EmiratesUnited KingdomUnited StatesUpper middle incomeUruguayUzbekistanVenezuela, RBVietnamWorldYemen, Rep.ZambiaZimbabwe Timeline:
This timeline shows a graph from 1961 to 2015 of Luxembourg. No data until 1960. Number of actual observations by date: 55.
Source name:
World Development Indicators
Source organization:
IEA Statistics © OECD/IEA 2014 (http://www.iea.org/stats/index.asp), subject to https://www.iea.org/t&c/termsandconditions/
Categories, topics:
Energy & Mining, Climate Change, Infrastructure
Last updated:
apr 23, 2017
Indicators value changes by year
Maximum:
93.905
jan 1, 2004
At the date of observation
Value
Absolute change
Change from previous value
jan 1, 1970
0.069
+0.069
%
jan 1, 1971
0.147
+0.078
112.23%
jan 1, 1972
0.375
+0.228
154.5%
jan 1, 1973
5.263
+4.888
1.3K%
jan 1, 1974
10.187
+4.923
93.54%
jan 1, 1975
9.662
-0.525
-5.15%
jan 1, 1976
22.865
+13.203
136.66%
jan 1, 1977
42.153
+19.288
84.36%
jan 1, 1978
41.461
-0.692
-1.64%
jan 1, 1979
36.348
-5.114
-12.33%
jan 1, 1980
35.519
-0.829
-2.28%
jan 1, 1981
23.529
-11.99
-33.76%
jan 1, 1982
12.363
-11.167
-47.46%
jan 1, 1983
0.369
-11.994
-97.02%
jan 1, 1984
3.191
+2.822
764.89%
jan 1, 1985
2.602
-0.589
-18.46%
jan 1, 1986
0.771
-1.832
-70.38%
jan 1, 1987
0.17
-0.601
-77.93%
jan 1, 1988
10.554
+10.384
6.11K%
jan 1, 1989
3.084
-7.469
-70.77%
jan 1, 1990
7.278
+4.194
135.98%
jan 1, 1991
5.449
-1.83
-25.14%
jan 1, 1992
3.994
-1.454
-26.69%
jan 1, 1993
4.545
+0.551
13.8%
jan 1, 1994
3.428
-1.118
-24.59%
jan 1, 1995
8.666
+5.238
152.81%
jan 1, 1996
31.211
+22.546
260.18%
jan 1, 1997
42.727
+11.516
36.9%
jan 1, 1998
43.596
+0.869
2.03%
jan 1, 1999
53.279
+9.683
22.21%
jan 1, 2000
56.667
+3.388
6.36%
jan 1, 2001
50.948
-5.719
-10.09%
jan 1, 2002
76.817
+25.869
50.77%
jan 1, 2003
93.447
+16.631
21.65%
jan 1, 2004
93.905
+0.457
0.49%
jan 1, 2005
93.199
-0.705
-0.75%
jan 1, 2006
92.802
-0.398
-0.43%
jan 1, 2007
92.009
-0.793
-0.85%
jan 1, 2008
90.44
-1.569
-1.7%
jan 1, 2009
88.114
-2.326
-2.57%
jan 1, 2010
90.197
+2.082
2.36%
jan 1, 2011
90.279
+0.082
0.09%
jan 1, 2012
88.34
-1.939
-2.15%
jan 1, 2013
86.616
-1.724
-1.95%
jan 1, 2014
76.798
-9.818
-11.33%
jan 1, 2015
75.801
-0.997
-1.3%
Ranking of countries by current statistics by years


Comments: