29
/
en
AIzaSyAYiBZKx7MnpbEhh9jyipgxe19OcubqV5w
April 1, 2024
117788
Czech Republic
CZE
true
2
1
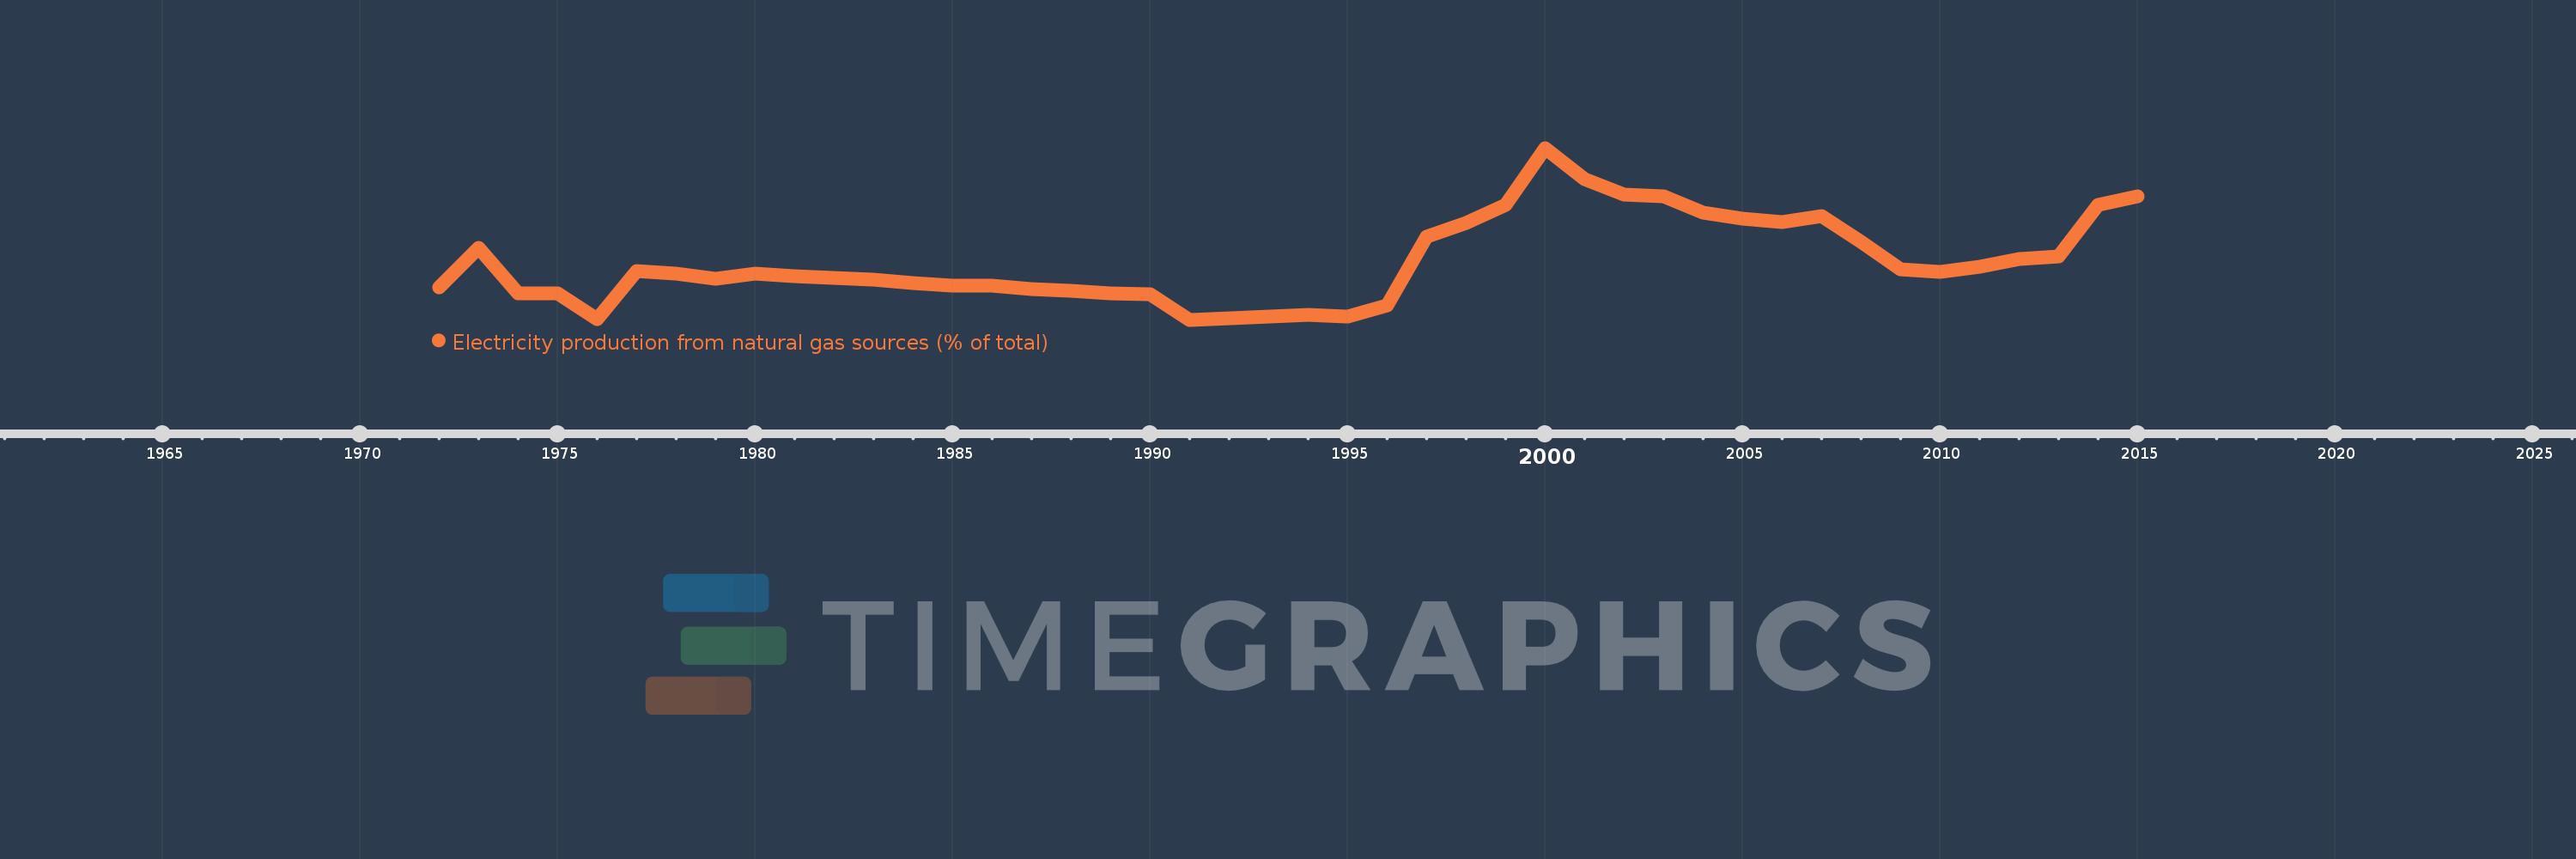
Electricity production from natural gas sources (% of total)
2015,2014,2013,2012,2011,2010,2009,2008,2007,2006,2005,2004,2003,2002,2001,2000,1999,1998,1997,1996,1995,1994,1993,1992,1991,1990,1989,1988,1987,1986,1985,1984,1983,1982,1981,1980,1979,1978,1977,1976,1975,1974,1973,1972
This statistics in other country:
AlbaniaAlgeriaAngolaArab WorldArgentinaArmeniaAustraliaAustriaAzerbaijanBahrainBangladeshBelarusBelgiumBeninBoliviaBosnia and HerzegovinaBotswanaBrazilBrunei DarussalamBulgariaCambodiaCameroonCanadaCentral Europe and the BalticsChileChinaColombiaCongo, Dem. Rep.Congo, Rep.Costa RicaCote d'IvoireCroatiaCubaCuracaoCyprusCzech RepublicDenmarkDominican RepublicEarly-demographic dividendEast Asia & PacificEast Asia & Pacific (excluding high income)East Asia & Pacific (IDA & IBRD countries)EcuadorEgypt, Arab Rep.El SalvadorEritreaEstoniaEthiopiaEuro areaEurope & Central AsiaEurope & Central Asia (excluding high income)Europe & Central Asia (IDA & IBRD countries)European UnionFinlandFragile and conflict affected situationsFranceGabonGeorgiaGermanyGhanaGibraltarGreeceGuatemalaHaitiHeavily indebted poor countries (HIPC)High incomeHondurasHong Kong SAR, ChinaHungaryIBRD onlyIcelandIDA & IBRD totalIDA blendIDA onlyIDA totalIndiaIndonesiaIran, Islamic Rep.IraqIrelandIsraelItalyJamaicaJapanJordanKazakhstanKenyaKorea, Dem. People’s Rep.Korea, Rep.KosovoKuwaitKyrgyz RepublicLate-demographic dividendLatin America & Caribbean Latin America & Caribbean (excluding high income)Latin America & the Caribbean (IDA & IBRD countries)LatviaLeast developed countries: UN classificationLebanonLibyaLithuaniaLow & middle incomeLower middle incomeLuxembourgMacedonia, FYRMalaysiaMaltaMauritiusMexicoMiddle East & North AfricaMiddle East & North Africa (excluding high income)Middle East & North Africa (IDA & IBRD countries)Middle incomeMoldovaMongoliaMontenegroMoroccoMozambiqueMyanmarNamibiaNepalNetherlandsNew ZealandNicaraguaNigerNigeriaNorth AmericaNorwayOECD membersOmanOther small statesPakistanPanamaParaguayPeruPhilippinesPolandPortugalPost-demographic dividendPre-demographic dividendQatarRomaniaRussian FederationSaudi ArabiaSenegalSerbiaSingaporeSlovak RepublicSloveniaSmall statesSouth AfricaSouth AsiaSouth Asia (IDA & IBRD)South SudanSpainSri LankaSub-Saharan Africa Sub-Saharan Africa (excluding high income)Sub-Saharan Africa (IDA & IBRD countries)SudanSwedenSwitzerlandSyrian Arab RepublicTajikistanTanzaniaThailandTogoTrinidad and TobagoTunisiaTurkeyTurkmenistanUkraineUnited Arab EmiratesUnited KingdomUnited StatesUpper middle incomeUruguayUzbekistanVenezuela, RBVietnamWorldYemen, Rep.ZambiaZimbabwe Timeline:
This timeline shows a graph from 1972 to 2015 of Czech Republic. No data until 1971. Number of actual observations by date: 44.
Source name:
World Development Indicators
Source organization:
IEA Statistics © OECD/IEA 2014 (http://www.iea.org/stats/index.asp), subject to https://www.iea.org/t&c/termsandconditions/
Categories, topics:
Energy & Mining, Climate Change, Infrastructure
Last updated:
apr 23, 2017
Indicators value changes by year
At the date of observation
Value
Absolute change
Change from previous value
jan 1, 1972
1.004
+1.004
0.0%
jan 1, 1973
1.483
+0.48
47.79%
jan 1, 1974
0.933
-0.55
-37.12%
jan 1, 1975
0.932
-0.001
-0.08%
jan 1, 1976
0.63
-0.302
-32.44%
jan 1, 1977
1.211
+0.581
92.35%
jan 1, 1978
1.172
-0.039
-3.21%
jan 1, 1979
1.118
-0.054
-4.6%
jan 1, 1980
1.171
+0.053
4.71%
jan 1, 1981
1.139
-0.031
-2.67%
jan 1, 1982
1.12
-0.02
-1.72%
jan 1, 1983
1.098
-0.022
-1.96%
jan 1, 1984
1.059
-0.039
-3.54%
jan 1, 1985
1.034
-0.025
-2.37%
jan 1, 1986
1.032
-0.002
-0.17%
jan 1, 1987
0.99
-0.042
-4.1%
jan 1, 1988
0.965
-0.025
-2.56%
jan 1, 1989
0.933
-0.032
-3.32%
jan 1, 1990
0.921
-0.011
-1.22%
jan 1, 1991
0.618
-0.303
-32.89%
jan 1, 1992
0.632
+0.014
2.2%
jan 1, 1993
0.652
+0.02
3.17%
jan 1, 1994
0.679
+0.027
4.09%
jan 1, 1995
0.661
-0.017
-2.57%
jan 1, 1996
0.791
+0.13
19.62%
jan 1, 1997
1.623
+0.832
105.28%
jan 1, 1998
1.792
+0.169
10.42%
jan 1, 1999
2.002
+0.21
11.72%
jan 1, 2000
2.693
+0.691
34.51%
jan 1, 2001
2.319
-0.374
-13.89%
jan 1, 2002
2.128
-0.191
-8.23%
jan 1, 2003
2.112
-0.016
-0.77%
jan 1, 2004
1.913
-0.199
-9.44%
jan 1, 2005
1.842
-0.071
-3.72%
jan 1, 2006
1.794
-0.047
-2.57%
jan 1, 2007
1.873
+0.079
4.4%
jan 1, 2008
1.561
-0.312
-16.67%
jan 1, 2009
1.224
-0.337
-21.59%
jan 1, 2010
1.193
-0.031
-2.5%
jan 1, 2011
1.258
+0.064
5.38%
jan 1, 2012
1.348
+0.091
7.2%
jan 1, 2013
1.386
+0.038
2.84%
jan 1, 2014
2.004
+0.618
44.57%
jan 1, 2015
2.113
+0.108
5.41%
Ranking of countries by current statistics by years


Comments: