29
/
en
AIzaSyAYiBZKx7MnpbEhh9jyipgxe19OcubqV5w
April 1, 2024
257202
Switzerland
CHE
true
2
1
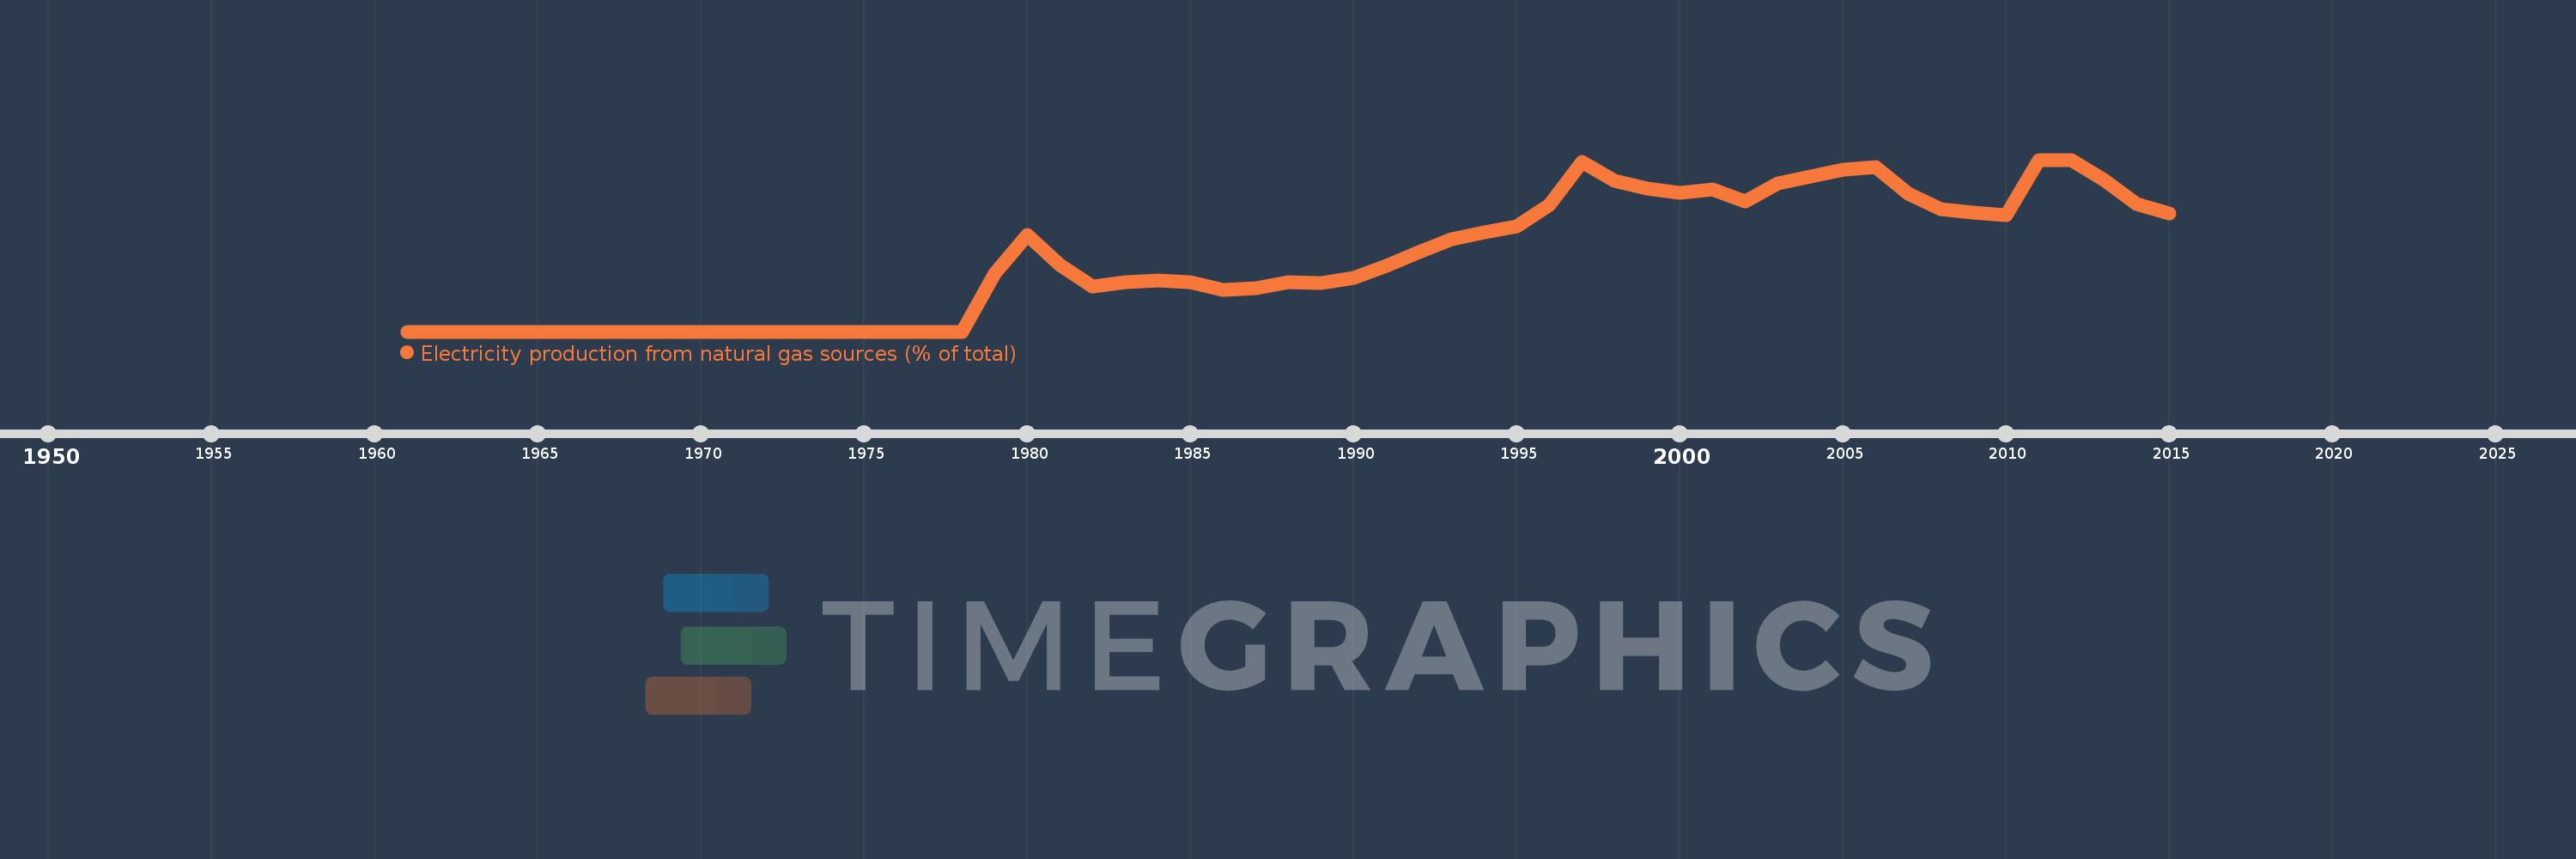
Electricity production from natural gas sources (% of total)
2015,2014,2013,2012,2011,2010,2009,2008,2007,2006,2005,2004,2003,2002,2001,2000,1999,1998,1997,1996,1995,1994,1993,1992,1991,1990,1989,1988,1987,1986,1985,1984,1983,1982,1981,1980,1979,1978,1977,1976,1975,1974,1973,1972,1971,1970,1969,1968,1967,1966,1965,1964,1963,1962,1961
This statistics in other country:
AlbaniaAlgeriaAngolaArab WorldArgentinaArmeniaAustraliaAustriaAzerbaijanBahrainBangladeshBelarusBelgiumBeninBoliviaBosnia and HerzegovinaBotswanaBrazilBrunei DarussalamBulgariaCambodiaCameroonCanadaCentral Europe and the BalticsChileChinaColombiaCongo, Dem. Rep.Congo, Rep.Costa RicaCote d'IvoireCroatiaCubaCuracaoCyprusCzech RepublicDenmarkDominican RepublicEarly-demographic dividendEast Asia & PacificEast Asia & Pacific (excluding high income)East Asia & Pacific (IDA & IBRD countries)EcuadorEgypt, Arab Rep.El SalvadorEritreaEstoniaEthiopiaEuro areaEurope & Central AsiaEurope & Central Asia (excluding high income)Europe & Central Asia (IDA & IBRD countries)European UnionFinlandFragile and conflict affected situationsFranceGabonGeorgiaGermanyGhanaGibraltarGreeceGuatemalaHaitiHeavily indebted poor countries (HIPC)High incomeHondurasHong Kong SAR, ChinaHungaryIBRD onlyIcelandIDA & IBRD totalIDA blendIDA onlyIDA totalIndiaIndonesiaIran, Islamic Rep.IraqIrelandIsraelItalyJamaicaJapanJordanKazakhstanKenyaKorea, Dem. People’s Rep.Korea, Rep.KosovoKuwaitKyrgyz RepublicLate-demographic dividendLatin America & Caribbean Latin America & Caribbean (excluding high income)Latin America & the Caribbean (IDA & IBRD countries)LatviaLeast developed countries: UN classificationLebanonLibyaLithuaniaLow & middle incomeLower middle incomeLuxembourgMacedonia, FYRMalaysiaMaltaMauritiusMexicoMiddle East & North AfricaMiddle East & North Africa (excluding high income)Middle East & North Africa (IDA & IBRD countries)Middle incomeMoldovaMongoliaMontenegroMoroccoMozambiqueMyanmarNamibiaNepalNetherlandsNew ZealandNicaraguaNigerNigeriaNorth AmericaNorwayOECD membersOmanOther small statesPakistanPanamaParaguayPeruPhilippinesPolandPortugalPost-demographic dividendPre-demographic dividendQatarRomaniaRussian FederationSaudi ArabiaSenegalSerbiaSingaporeSlovak RepublicSloveniaSmall statesSouth AfricaSouth AsiaSouth Asia (IDA & IBRD)South SudanSpainSri LankaSub-Saharan Africa Sub-Saharan Africa (excluding high income)Sub-Saharan Africa (IDA & IBRD countries)SudanSwedenSwitzerlandSyrian Arab RepublicTajikistanTanzaniaThailandTogoTrinidad and TobagoTunisiaTurkeyTurkmenistanUkraineUnited Arab EmiratesUnited KingdomUnited StatesUpper middle incomeUruguayUzbekistanVenezuela, RBVietnamWorldYemen, Rep.ZambiaZimbabwe Timeline:
This timeline shows a graph from 1961 to 2015 of Switzerland. No data until 1960. Number of actual observations by date: 55.
Source name:
World Development Indicators
Source organization:
IEA Statistics © OECD/IEA 2014 (http://www.iea.org/stats/index.asp), subject to https://www.iea.org/t&c/termsandconditions/
Categories, topics:
Energy & Mining, Climate Change, Infrastructure
Last updated:
apr 23, 2017
Indicators value changes by year
At the date of observation
Value
Absolute change
Change from previous value
jan 1, 1979
0.528
+0.528
%
jan 1, 1980
0.882
+0.354
67.1%
jan 1, 1981
0.61
-0.272
-30.81%
jan 1, 1982
0.409
-0.201
-32.98%
jan 1, 1983
0.451
+0.042
10.36%
jan 1, 1984
0.467
+0.016
3.57%
jan 1, 1985
0.452
-0.015
-3.31%
jan 1, 1986
0.384
-0.068
-15.15%
jan 1, 1987
0.396
+0.013
3.3%
jan 1, 1988
0.454
+0.058
14.63%
jan 1, 1989
0.441
-0.013
-2.96%
jan 1, 1990
0.491
+0.05
11.45%
jan 1, 1991
0.6
+0.109
22.17%
jan 1, 1992
0.723
+0.122
20.4%
jan 1, 1993
0.84
+0.118
16.3%
jan 1, 1994
0.907
+0.067
7.94%
jan 1, 1995
0.96
+0.053
5.84%
jan 1, 1996
1.16
+0.2
20.83%
jan 1, 1997
1.552
+0.392
33.81%
jan 1, 1998
1.374
-0.178
-11.45%
jan 1, 1999
1.308
-0.066
-4.82%
jan 1, 2000
1.267
-0.041
-3.15%
jan 1, 2001
1.296
+0.029
2.3%
jan 1, 2002
1.191
-0.105
-8.14%
jan 1, 2003
1.358
+0.167
14.06%
jan 1, 2004
1.414
+0.056
4.15%
jan 1, 2005
1.478
+0.064
4.51%
jan 1, 2006
1.506
+0.027
1.85%
jan 1, 2007
1.263
-0.242
-16.08%
jan 1, 2008
1.115
-0.148
-11.72%
jan 1, 2009
1.089
-0.026
-2.36%
jan 1, 2010
1.066
-0.023
-2.07%
jan 1, 2011
1.57
+0.504
47.22%
jan 1, 2012
1.565
-0.005
-0.34%
jan 1, 2013
1.384
-0.18
-11.52%
jan 1, 2014
1.169
-0.216
-15.59%
jan 1, 2015
1.08
-0.089
-7.59%
Ranking of countries by current statistics by years


Comments: