29
/
en
AIzaSyAYiBZKx7MnpbEhh9jyipgxe19OcubqV5w
April 1, 2024
56153
Small states
SST
false
2
1
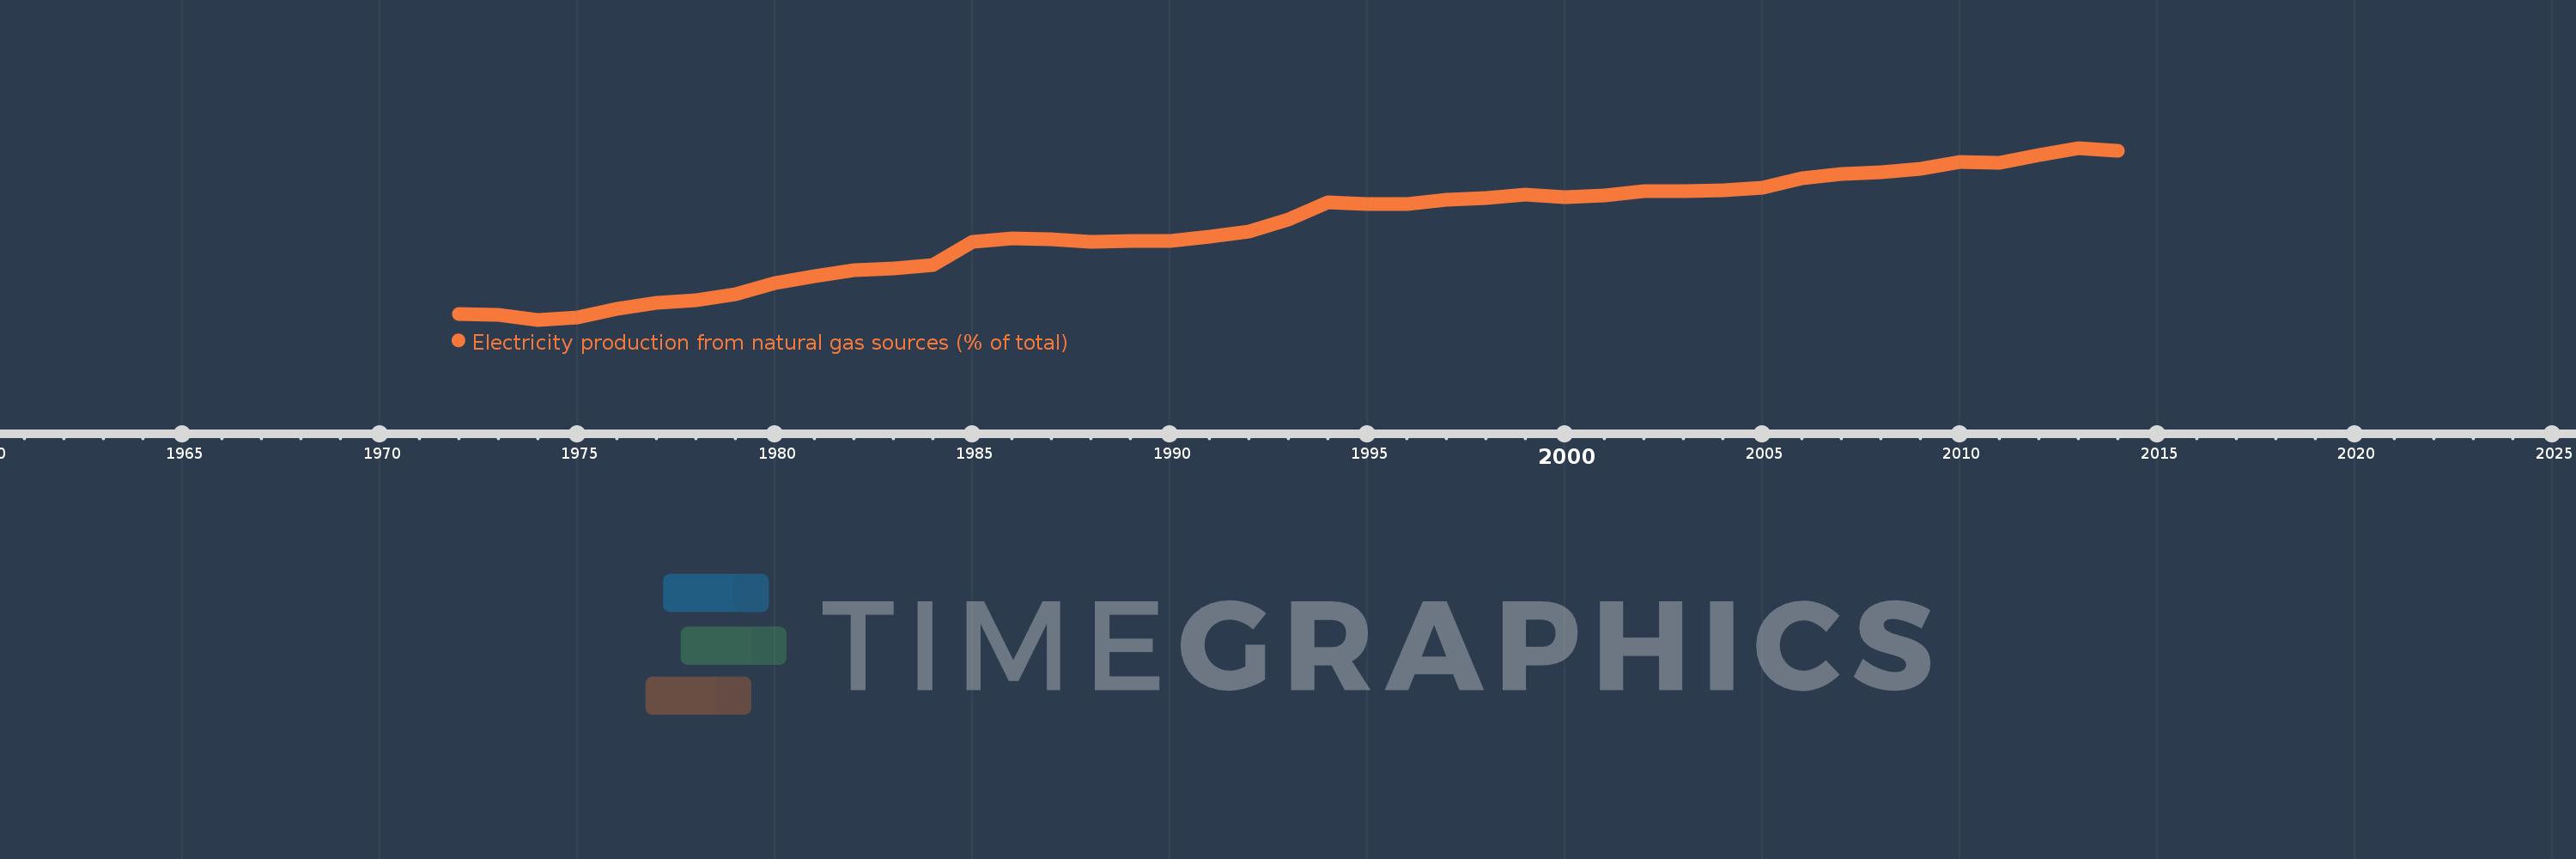
Electricity production from natural gas sources (% of total)
2014,2013,2012,2011,2010,2009,2008,2007,2006,2005,2004,2003,2002,2001,2000,1999,1998,1997,1996,1995,1994,1993,1992,1991,1990,1989,1988,1987,1986,1985,1984,1983,1982,1981,1980,1979,1978,1977,1976,1975,1974,1973,1972
This statistics in other country:
AlbaniaAlgeriaAngolaArab WorldArgentinaArmeniaAustraliaAustriaAzerbaijanBahrainBangladeshBelarusBelgiumBeninBoliviaBosnia and HerzegovinaBotswanaBrazilBrunei DarussalamBulgariaCambodiaCameroonCanadaCentral Europe and the BalticsChileChinaColombiaCongo, Dem. Rep.Congo, Rep.Costa RicaCote d'IvoireCroatiaCubaCuracaoCyprusCzech RepublicDenmarkDominican RepublicEarly-demographic dividendEast Asia & PacificEast Asia & Pacific (excluding high income)East Asia & Pacific (IDA & IBRD countries)EcuadorEgypt, Arab Rep.El SalvadorEritreaEstoniaEthiopiaEuro areaEurope & Central AsiaEurope & Central Asia (excluding high income)Europe & Central Asia (IDA & IBRD countries)European UnionFinlandFragile and conflict affected situationsFranceGabonGeorgiaGermanyGhanaGibraltarGreeceGuatemalaHaitiHeavily indebted poor countries (HIPC)High incomeHondurasHong Kong SAR, ChinaHungaryIBRD onlyIcelandIDA & IBRD totalIDA blendIDA onlyIDA totalIndiaIndonesiaIran, Islamic Rep.IraqIrelandIsraelItalyJamaicaJapanJordanKazakhstanKenyaKorea, Dem. People’s Rep.Korea, Rep.KosovoKuwaitKyrgyz RepublicLate-demographic dividendLatin America & Caribbean Latin America & Caribbean (excluding high income)Latin America & the Caribbean (IDA & IBRD countries)LatviaLeast developed countries: UN classificationLebanonLibyaLithuaniaLow & middle incomeLower middle incomeLuxembourgMacedonia, FYRMalaysiaMaltaMauritiusMexicoMiddle East & North AfricaMiddle East & North Africa (excluding high income)Middle East & North Africa (IDA & IBRD countries)Middle incomeMoldovaMongoliaMontenegroMoroccoMozambiqueMyanmarNamibiaNepalNetherlandsNew ZealandNicaraguaNigerNigeriaNorth AmericaNorwayOECD membersOmanOther small statesPakistanPanamaParaguayPeruPhilippinesPolandPortugalPost-demographic dividendPre-demographic dividendQatarRomaniaRussian FederationSaudi ArabiaSenegalSerbiaSingaporeSlovak RepublicSloveniaSmall statesSouth AfricaSouth AsiaSouth Asia (IDA & IBRD)South SudanSpainSri LankaSub-Saharan Africa Sub-Saharan Africa (excluding high income)Sub-Saharan Africa (IDA & IBRD countries)SudanSwedenSwitzerlandSyrian Arab RepublicTajikistanTanzaniaThailandTogoTrinidad and TobagoTunisiaTurkeyTurkmenistanUkraineUnited Arab EmiratesUnited KingdomUnited StatesUpper middle incomeUruguayUzbekistanVenezuela, RBVietnamWorldYemen, Rep.ZambiaZimbabwe Timeline:
This timeline shows a graph from 1972 to 2014 of Small states. No data until 1971. Number of actual observations by date: 43.
Source name:
World Development Indicators
Source organization:
IEA Statistics © OECD/IEA 2014 (http://www.iea.org/stats/index.asp), subject to https://www.iea.org/t&c/termsandconditions/
Categories, topics:
Energy & Mining, Climate Change, Infrastructure
Last updated:
apr 23, 2017
Indicators value changes by year
Minimum:
12.735
jan 1, 1974
At the date of observation
Value
Absolute change
Change from previous value
jan 1, 1972
14.018
+14.018
0.0%
jan 1, 1973
13.812
-0.206
-1.47%
jan 1, 1974
12.735
-1.077
-7.8%
jan 1, 1975
13.282
+0.548
4.3%
jan 1, 1976
15.171
+1.889
14.22%
jan 1, 1977
16.486
+1.315
8.67%
jan 1, 1978
17.046
+0.56
3.4%
jan 1, 1979
18.392
+1.346
7.9%
jan 1, 1980
20.768
+2.376
12.92%
jan 1, 1981
22.311
+1.544
7.43%
jan 1, 1982
23.603
+1.292
5.79%
jan 1, 1983
24.052
+0.449
1.9%
jan 1, 1984
24.677
+0.626
2.6%
jan 1, 1985
29.84
+5.162
20.92%
jan 1, 1986
30.567
+0.727
2.44%
jan 1, 1987
30.384
-0.183
-0.6%
jan 1, 1988
29.755
-0.629
-2.07%
jan 1, 1989
29.906
+0.151
0.51%
jan 1, 1990
29.925
+0.019
0.06%
jan 1, 1991
31.013
+1.088
3.64%
jan 1, 1992
32.146
+1.133
3.65%
jan 1, 1993
34.663
+2.517
7.83%
jan 1, 1994
38.386
+3.723
10.74%
jan 1, 1995
38.104
-0.283
-0.74%
jan 1, 1996
38.13
+0.026
0.07%
jan 1, 1997
39.08
+0.95
2.49%
jan 1, 1998
39.495
+0.415
1.06%
jan 1, 1999
40.189
+0.694
1.76%
jan 1, 2000
39.634
-0.554
-1.38%
jan 1, 2001
39.991
+0.357
0.9%
jan 1, 2002
40.845
+0.854
2.13%
jan 1, 2003
40.984
+0.139
0.34%
jan 1, 2004
41.157
+0.173
0.42%
jan 1, 2005
41.754
+0.597
1.45%
jan 1, 2006
43.761
+2.007
4.81%
jan 1, 2007
44.654
+0.893
2.04%
jan 1, 2008
45.081
+0.427
0.96%
jan 1, 2009
45.828
+0.747
1.66%
jan 1, 2010
47.272
+1.444
3.15%
jan 1, 2011
47.209
-0.063
-0.13%
jan 1, 2012
48.849
+1.64
3.47%
jan 1, 2013
50.39
+1.541
3.15%
jan 1, 2014
49.778
-0.611
-1.21%
Ranking of countries by current statistics by years


Comments: