29
/
en
AIzaSyAYiBZKx7MnpbEhh9jyipgxe19OcubqV5w
April 1, 2024
139159
Germany
DEU
true
2
1
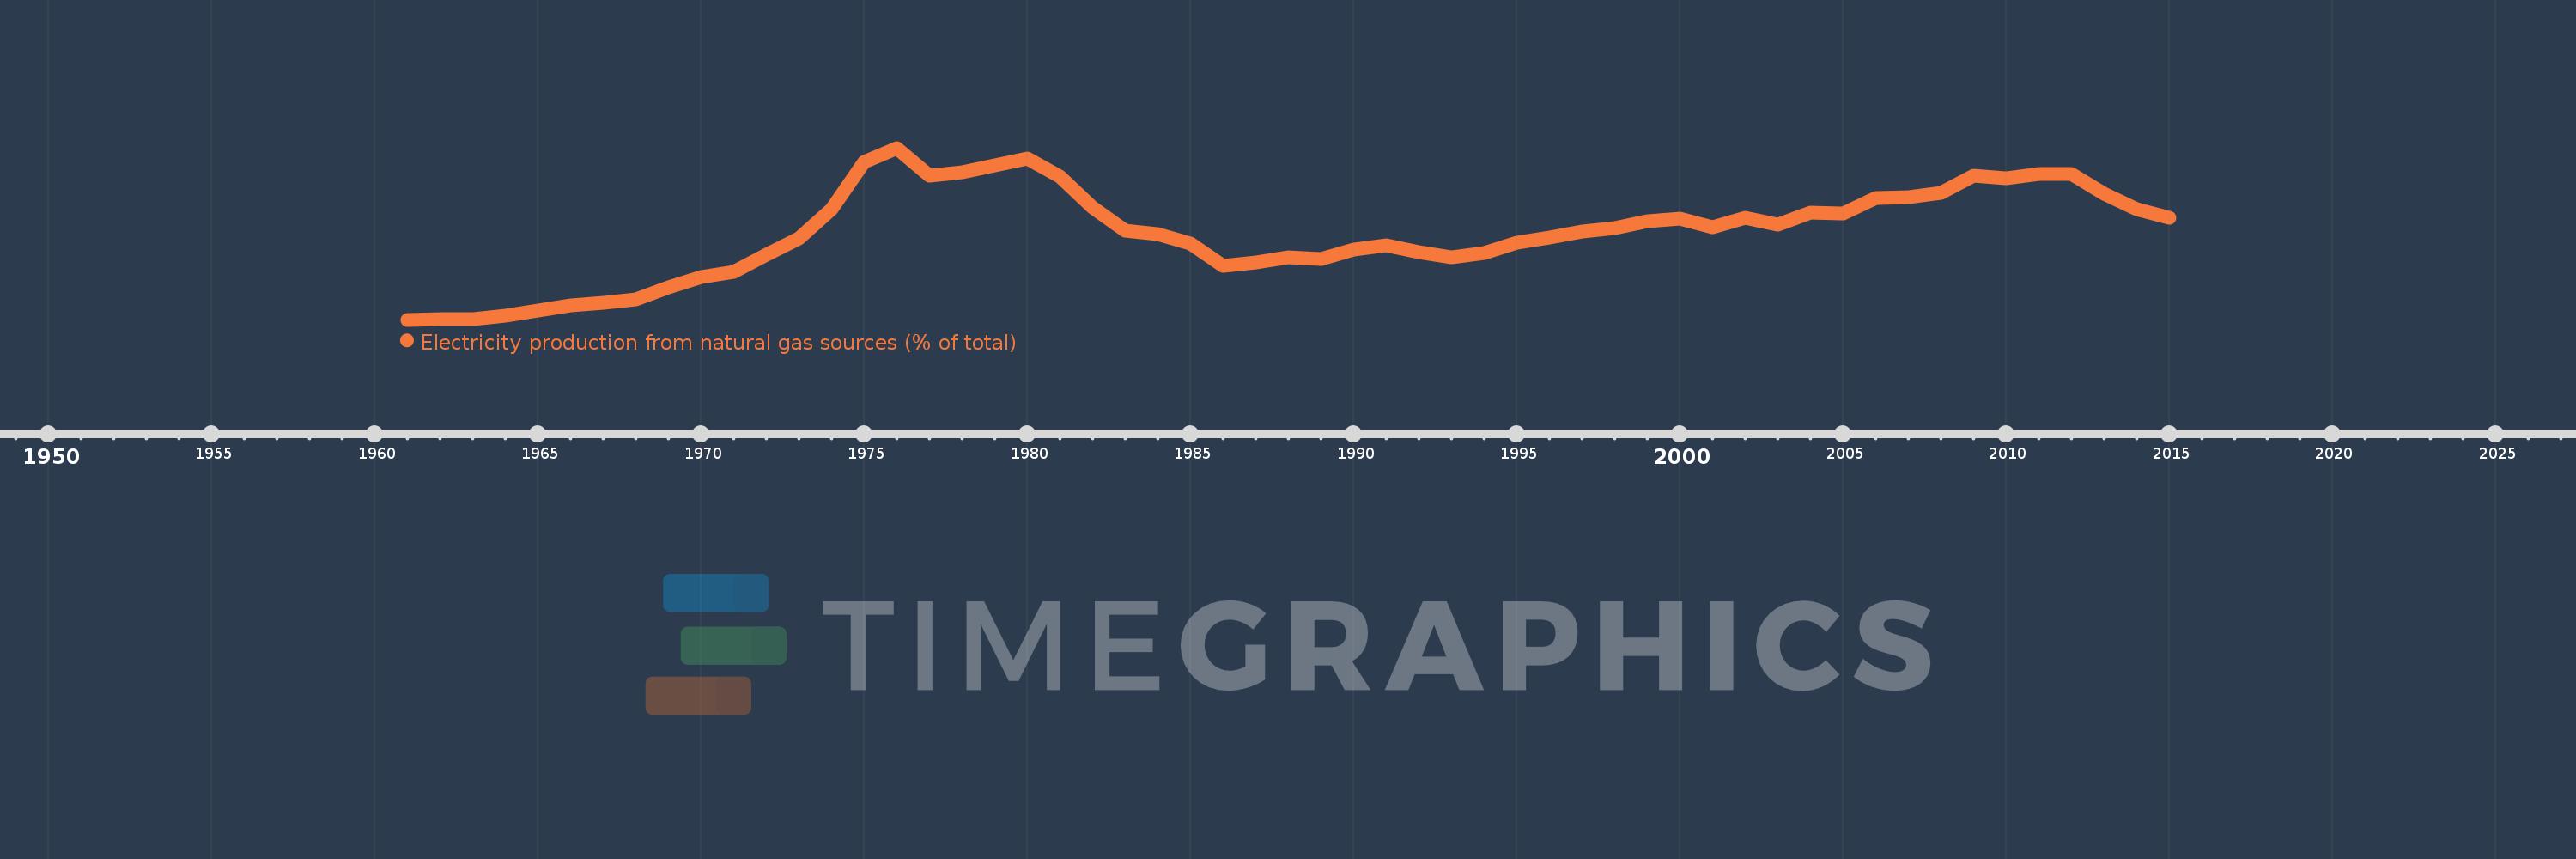
Electricity production from natural gas sources (% of total)
2015,2014,2013,2012,2011,2010,2009,2008,2007,2006,2005,2004,2003,2002,2001,2000,1999,1998,1997,1996,1995,1994,1993,1992,1991,1990,1989,1988,1987,1986,1985,1984,1983,1982,1981,1980,1979,1978,1977,1976,1975,1974,1973,1972,1971,1970,1969,1968,1967,1966,1965,1964,1963,1962,1961
This statistics in other country:
AlbaniaAlgeriaAngolaArab WorldArgentinaArmeniaAustraliaAustriaAzerbaijanBahrainBangladeshBelarusBelgiumBeninBoliviaBosnia and HerzegovinaBotswanaBrazilBrunei DarussalamBulgariaCambodiaCameroonCanadaCentral Europe and the BalticsChileChinaColombiaCongo, Dem. Rep.Congo, Rep.Costa RicaCote d'IvoireCroatiaCubaCuracaoCyprusCzech RepublicDenmarkDominican RepublicEarly-demographic dividendEast Asia & PacificEast Asia & Pacific (excluding high income)East Asia & Pacific (IDA & IBRD countries)EcuadorEgypt, Arab Rep.El SalvadorEritreaEstoniaEthiopiaEuro areaEurope & Central AsiaEurope & Central Asia (excluding high income)Europe & Central Asia (IDA & IBRD countries)European UnionFinlandFragile and conflict affected situationsFranceGabonGeorgiaGermanyGhanaGibraltarGreeceGuatemalaHaitiHeavily indebted poor countries (HIPC)High incomeHondurasHong Kong SAR, ChinaHungaryIBRD onlyIcelandIDA & IBRD totalIDA blendIDA onlyIDA totalIndiaIndonesiaIran, Islamic Rep.IraqIrelandIsraelItalyJamaicaJapanJordanKazakhstanKenyaKorea, Dem. People’s Rep.Korea, Rep.KosovoKuwaitKyrgyz RepublicLate-demographic dividendLatin America & Caribbean Latin America & Caribbean (excluding high income)Latin America & the Caribbean (IDA & IBRD countries)LatviaLeast developed countries: UN classificationLebanonLibyaLithuaniaLow & middle incomeLower middle incomeLuxembourgMacedonia, FYRMalaysiaMaltaMauritiusMexicoMiddle East & North AfricaMiddle East & North Africa (excluding high income)Middle East & North Africa (IDA & IBRD countries)Middle incomeMoldovaMongoliaMontenegroMoroccoMozambiqueMyanmarNamibiaNepalNetherlandsNew ZealandNicaraguaNigerNigeriaNorth AmericaNorwayOECD membersOmanOther small statesPakistanPanamaParaguayPeruPhilippinesPolandPortugalPost-demographic dividendPre-demographic dividendQatarRomaniaRussian FederationSaudi ArabiaSenegalSerbiaSingaporeSlovak RepublicSloveniaSmall statesSouth AfricaSouth AsiaSouth Asia (IDA & IBRD)South SudanSpainSri LankaSub-Saharan Africa Sub-Saharan Africa (excluding high income)Sub-Saharan Africa (IDA & IBRD countries)SudanSwedenSwitzerlandSyrian Arab RepublicTajikistanTanzaniaThailandTogoTrinidad and TobagoTunisiaTurkeyTurkmenistanUkraineUnited Arab EmiratesUnited KingdomUnited StatesUpper middle incomeUruguayUzbekistanVenezuela, RBVietnamWorldYemen, Rep.ZambiaZimbabwe Timeline:
This timeline shows a graph from 1961 to 2015 of Germany. No data until 1960. Number of actual observations by date: 55.
Source name:
World Development Indicators
Source organization:
IEA Statistics © OECD/IEA 2014 (http://www.iea.org/stats/index.asp), subject to https://www.iea.org/t&c/termsandconditions/
Categories, topics:
Energy & Mining, Climate Change, Infrastructure
Last updated:
apr 23, 2017
Indicators value changes by year
Maximum:
16.933
jan 1, 1976
At the date of observation
Value
Absolute change
Change from previous value
jan 1, 1961
0.07
+0.07
0.0%
jan 1, 1962
0.12
+0.05
71.15%
jan 1, 1963
0.136
+0.016
13.23%
jan 1, 1964
0.436
+0.3
220.18%
jan 1, 1965
0.97
+0.534
122.32%
jan 1, 1966
1.454
+0.484
49.89%
jan 1, 1967
1.735
+0.282
19.39%
jan 1, 1968
2.06
+0.325
18.71%
jan 1, 1969
3.208
+1.148
55.71%
jan 1, 1970
4.261
+1.053
32.82%
jan 1, 1971
4.725
+0.464
10.89%
jan 1, 1972
6.494
+1.769
37.44%
jan 1, 1973
8.025
+1.532
23.59%
jan 1, 1974
10.939
+2.914
36.31%
jan 1, 1975
15.539
+4.599
42.04%
jan 1, 1976
16.933
+1.394
8.97%
jan 1, 1977
14.245
-2.688
-15.87%
jan 1, 1978
14.51
+0.265
1.86%
jan 1, 1979
15.237
+0.728
5.02%
jan 1, 1980
15.857
+0.619
4.06%
jan 1, 1981
14.151
-1.706
-10.76%
jan 1, 1982
11.088
-3.062
-21.64%
jan 1, 1983
8.829
-2.259
-20.37%
jan 1, 1984
8.469
-0.36
-4.08%
jan 1, 1985
7.55
-0.919
-10.85%
jan 1, 1986
5.376
-2.174
-28.8%
jan 1, 1987
5.713
+0.337
6.27%
jan 1, 1988
6.213
+0.5
8.75%
jan 1, 1989
6.057
-0.155
-2.5%
jan 1, 1990
6.921
+0.863
14.25%
jan 1, 1991
7.388
+0.467
6.75%
jan 1, 1992
6.739
-0.649
-8.79%
jan 1, 1993
6.163
-0.576
-8.54%
jan 1, 1994
6.617
+0.454
7.37%
jan 1, 1995
7.664
+1.047
15.82%
jan 1, 1996
8.104
+0.44
5.74%
jan 1, 1997
8.72
+0.615
7.59%
jan 1, 1998
9.074
+0.355
4.07%
jan 1, 1999
9.745
+0.671
7.39%
jan 1, 2000
9.965
+0.22
2.26%
jan 1, 2001
9.172
-0.793
-7.96%
jan 1, 2002
10.041
+0.869
9.47%
jan 1, 2003
9.367
-0.675
-6.72%
jan 1, 2004
10.582
+1.216
12.98%
jan 1, 2005
10.489
-0.094
-0.88%
jan 1, 2006
12.023
+1.534
14.62%
jan 1, 2007
12.132
+0.109
0.91%
jan 1, 2008
12.561
+0.429
3.54%
jan 1, 2009
14.232
+1.671
13.3%
jan 1, 2010
13.919
-0.313
-2.2%
jan 1, 2011
14.42
+0.501
3.6%
jan 1, 2012
14.365
-0.055
-0.38%
jan 1, 2013
12.442
-1.923
-13.39%
jan 1, 2014
10.956
-1.486
-11.94%
jan 1, 2015
10.062
-0.895
-8.17%
Ranking of countries by current statistics by years


Comments: