29
/
en
AIzaSyAYiBZKx7MnpbEhh9jyipgxe19OcubqV5w
April 1, 2024
58848
Sub-Saharan Africa
SSF
false
2
1
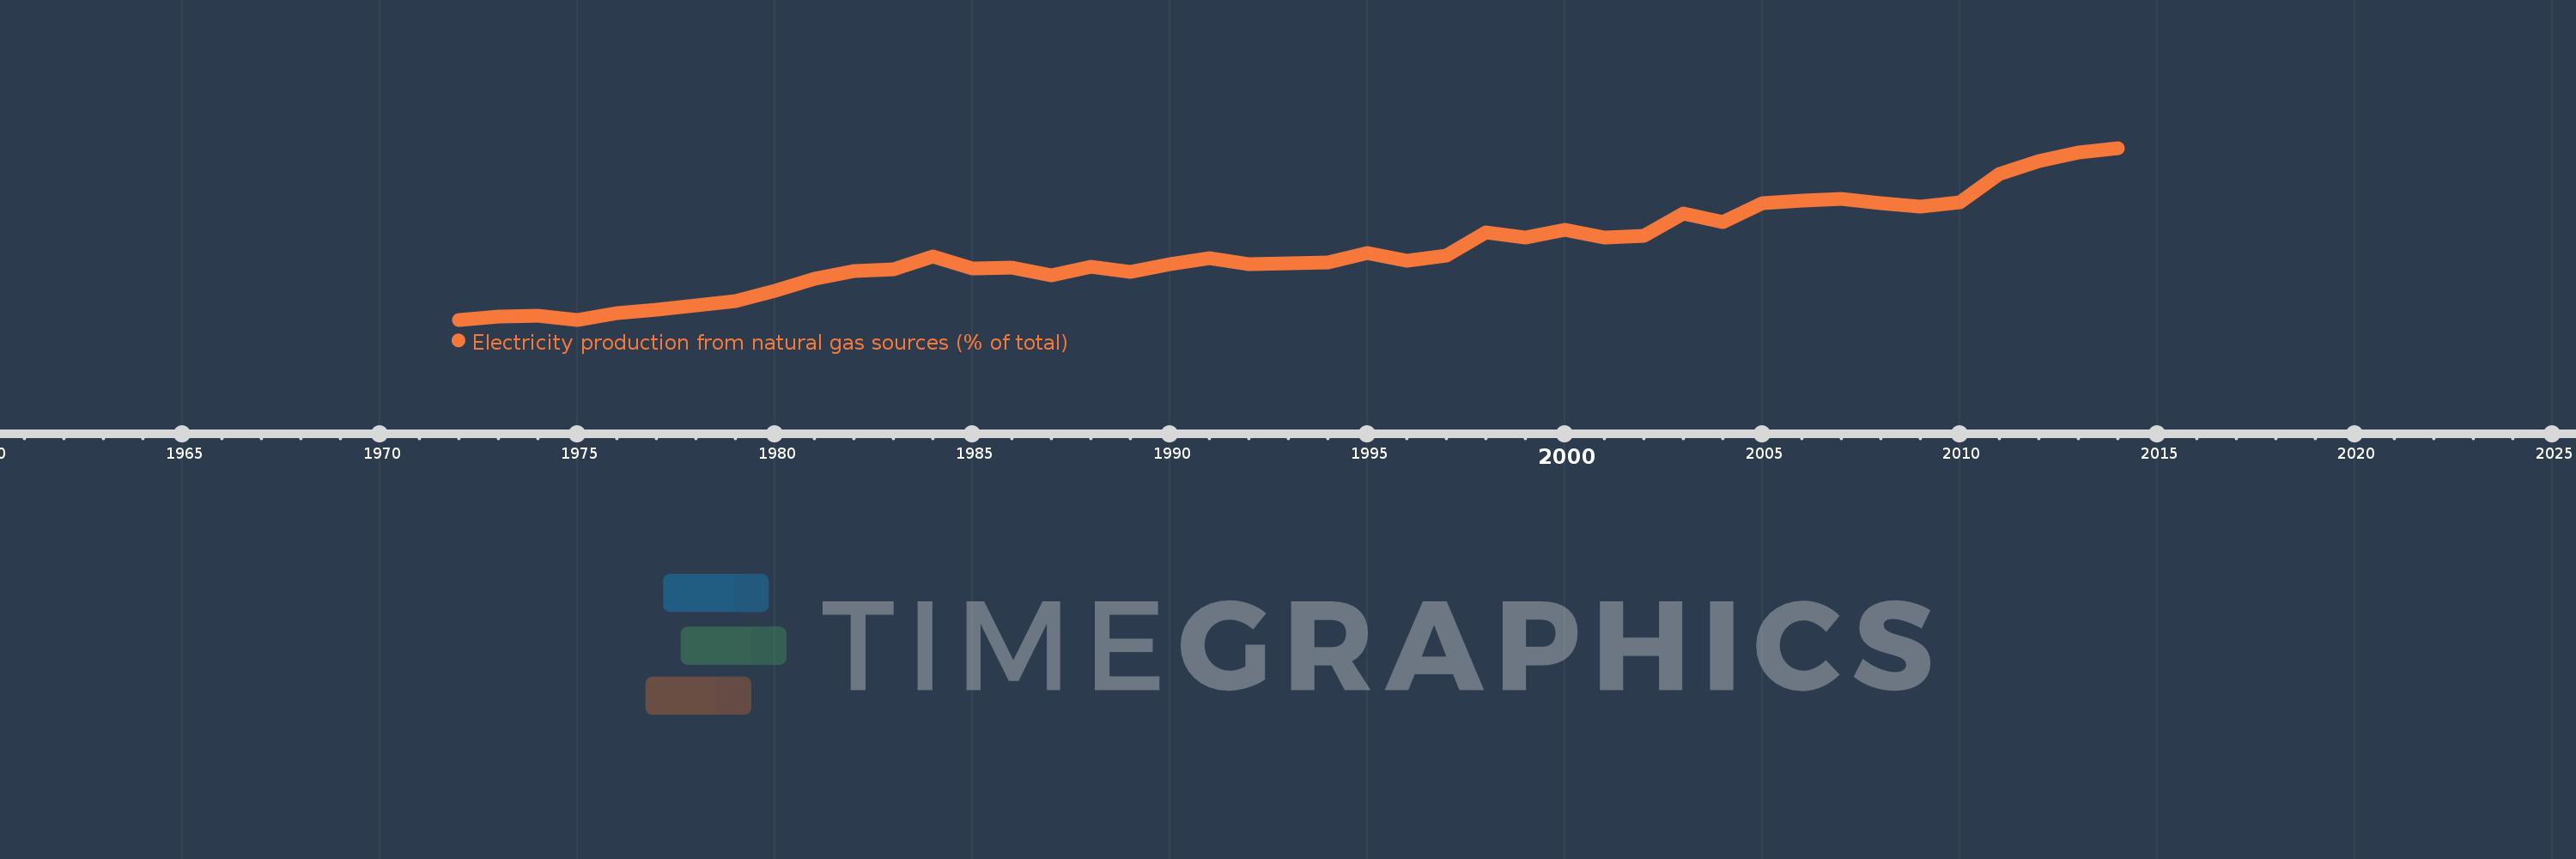
Electricity production from natural gas sources (% of total)
2014,2013,2012,2011,2010,2009,2008,2007,2006,2005,2004,2003,2002,2001,2000,1999,1998,1997,1996,1995,1994,1993,1992,1991,1990,1989,1988,1987,1986,1985,1984,1983,1982,1981,1980,1979,1978,1977,1976,1975,1974,1973,1972
This statistics in other country:
AlbaniaAlgeriaAngolaArab WorldArgentinaArmeniaAustraliaAustriaAzerbaijanBahrainBangladeshBelarusBelgiumBeninBoliviaBosnia and HerzegovinaBotswanaBrazilBrunei DarussalamBulgariaCambodiaCameroonCanadaCentral Europe and the BalticsChileChinaColombiaCongo, Dem. Rep.Congo, Rep.Costa RicaCote d'IvoireCroatiaCubaCuracaoCyprusCzech RepublicDenmarkDominican RepublicEarly-demographic dividendEast Asia & PacificEast Asia & Pacific (excluding high income)East Asia & Pacific (IDA & IBRD countries)EcuadorEgypt, Arab Rep.El SalvadorEritreaEstoniaEthiopiaEuro areaEurope & Central AsiaEurope & Central Asia (excluding high income)Europe & Central Asia (IDA & IBRD countries)European UnionFinlandFragile and conflict affected situationsFranceGabonGeorgiaGermanyGhanaGibraltarGreeceGuatemalaHaitiHeavily indebted poor countries (HIPC)High incomeHondurasHong Kong SAR, ChinaHungaryIBRD onlyIcelandIDA & IBRD totalIDA blendIDA onlyIDA totalIndiaIndonesiaIran, Islamic Rep.IraqIrelandIsraelItalyJamaicaJapanJordanKazakhstanKenyaKorea, Dem. People’s Rep.Korea, Rep.KosovoKuwaitKyrgyz RepublicLate-demographic dividendLatin America & Caribbean Latin America & Caribbean (excluding high income)Latin America & the Caribbean (IDA & IBRD countries)LatviaLeast developed countries: UN classificationLebanonLibyaLithuaniaLow & middle incomeLower middle incomeLuxembourgMacedonia, FYRMalaysiaMaltaMauritiusMexicoMiddle East & North AfricaMiddle East & North Africa (excluding high income)Middle East & North Africa (IDA & IBRD countries)Middle incomeMoldovaMongoliaMontenegroMoroccoMozambiqueMyanmarNamibiaNepalNetherlandsNew ZealandNicaraguaNigerNigeriaNorth AmericaNorwayOECD membersOmanOther small statesPakistanPanamaParaguayPeruPhilippinesPolandPortugalPost-demographic dividendPre-demographic dividendQatarRomaniaRussian FederationSaudi ArabiaSenegalSerbiaSingaporeSlovak RepublicSloveniaSmall statesSouth AfricaSouth AsiaSouth Asia (IDA & IBRD)South SudanSpainSri LankaSub-Saharan Africa Sub-Saharan Africa (excluding high income)Sub-Saharan Africa (IDA & IBRD countries)SudanSwedenSwitzerlandSyrian Arab RepublicTajikistanTanzaniaThailandTogoTrinidad and TobagoTunisiaTurkeyTurkmenistanUkraineUnited Arab EmiratesUnited KingdomUnited StatesUpper middle incomeUruguayUzbekistanVenezuela, RBVietnamWorldYemen, Rep.ZambiaZimbabwe Timeline:
This timeline shows a graph from 1972 to 2014 of Sub-Saharan Africa . No data until 1971. Number of actual observations by date: 43.
Source name:
World Development Indicators
Source organization:
IEA Statistics © OECD/IEA 2014 (http://www.iea.org/stats/index.asp), subject to https://www.iea.org/t&c/termsandconditions/
Categories, topics:
Energy & Mining, Climate Change, Infrastructure
Last updated:
apr 23, 2017
Indicators value changes by year
At the date of observation
Value
Absolute change
Change from previous value
jan 1, 1972
0.143
+0.143
0.0%
jan 1, 1973
0.273
+0.13
90.94%
jan 1, 1974
0.306
+0.033
12.05%
jan 1, 1975
0.143
-0.163
-53.28%
jan 1, 1976
0.461
+0.318
222.01%
jan 1, 1977
0.607
+0.147
31.9%
jan 1, 1978
0.772
+0.164
27.07%
jan 1, 1979
0.996
+0.224
29.03%
jan 1, 1980
1.459
+0.463
46.49%
jan 1, 1981
1.988
+0.529
36.27%
jan 1, 1982
2.358
+0.37
18.61%
jan 1, 1983
2.416
+0.058
2.44%
jan 1, 1984
2.996
+0.581
24.05%
jan 1, 1985
2.441
-0.555
-18.54%
jan 1, 1986
2.494
+0.053
2.16%
jan 1, 1987
2.148
-0.346
-13.88%
jan 1, 1988
2.537
+0.39
18.14%
jan 1, 1989
2.294
-0.243
-9.59%
jan 1, 1990
2.673
+0.379
16.52%
jan 1, 1991
2.937
+0.264
9.89%
jan 1, 1992
2.644
-0.293
-9.97%
jan 1, 1993
2.675
+0.03
1.14%
jan 1, 1994
2.741
+0.067
2.5%
jan 1, 1995
3.163
+0.421
15.36%
jan 1, 1996
2.817
-0.345
-10.92%
jan 1, 1997
3.044
+0.227
8.04%
jan 1, 1998
4.108
+1.064
34.96%
jan 1, 1999
3.876
-0.231
-5.63%
jan 1, 2000
4.219
+0.342
8.83%
jan 1, 2001
3.854
-0.364
-8.64%
jan 1, 2002
3.945
+0.09
2.35%
jan 1, 2003
4.926
+0.981
24.87%
jan 1, 2004
4.564
-0.362
-7.36%
jan 1, 2005
5.401
+0.838
18.35%
jan 1, 2006
5.54
+0.139
2.58%
jan 1, 2007
5.604
+0.064
1.16%
jan 1, 2008
5.416
-0.188
-3.36%
jan 1, 2009
5.272
-0.144
-2.66%
jan 1, 2010
5.465
+0.192
3.65%
jan 1, 2011
6.716
+1.251
22.9%
jan 1, 2012
7.32
+0.604
9.0%
jan 1, 2013
7.685
+0.365
4.99%
jan 1, 2014
7.904
+0.219
2.85%
Ranking of countries by current statistics by years


Comments: