29
/
en
AIzaSyAYiBZKx7MnpbEhh9jyipgxe19OcubqV5w
April 1, 2024
34163
Fragile and conflict affected situations
FCS
false
2
1
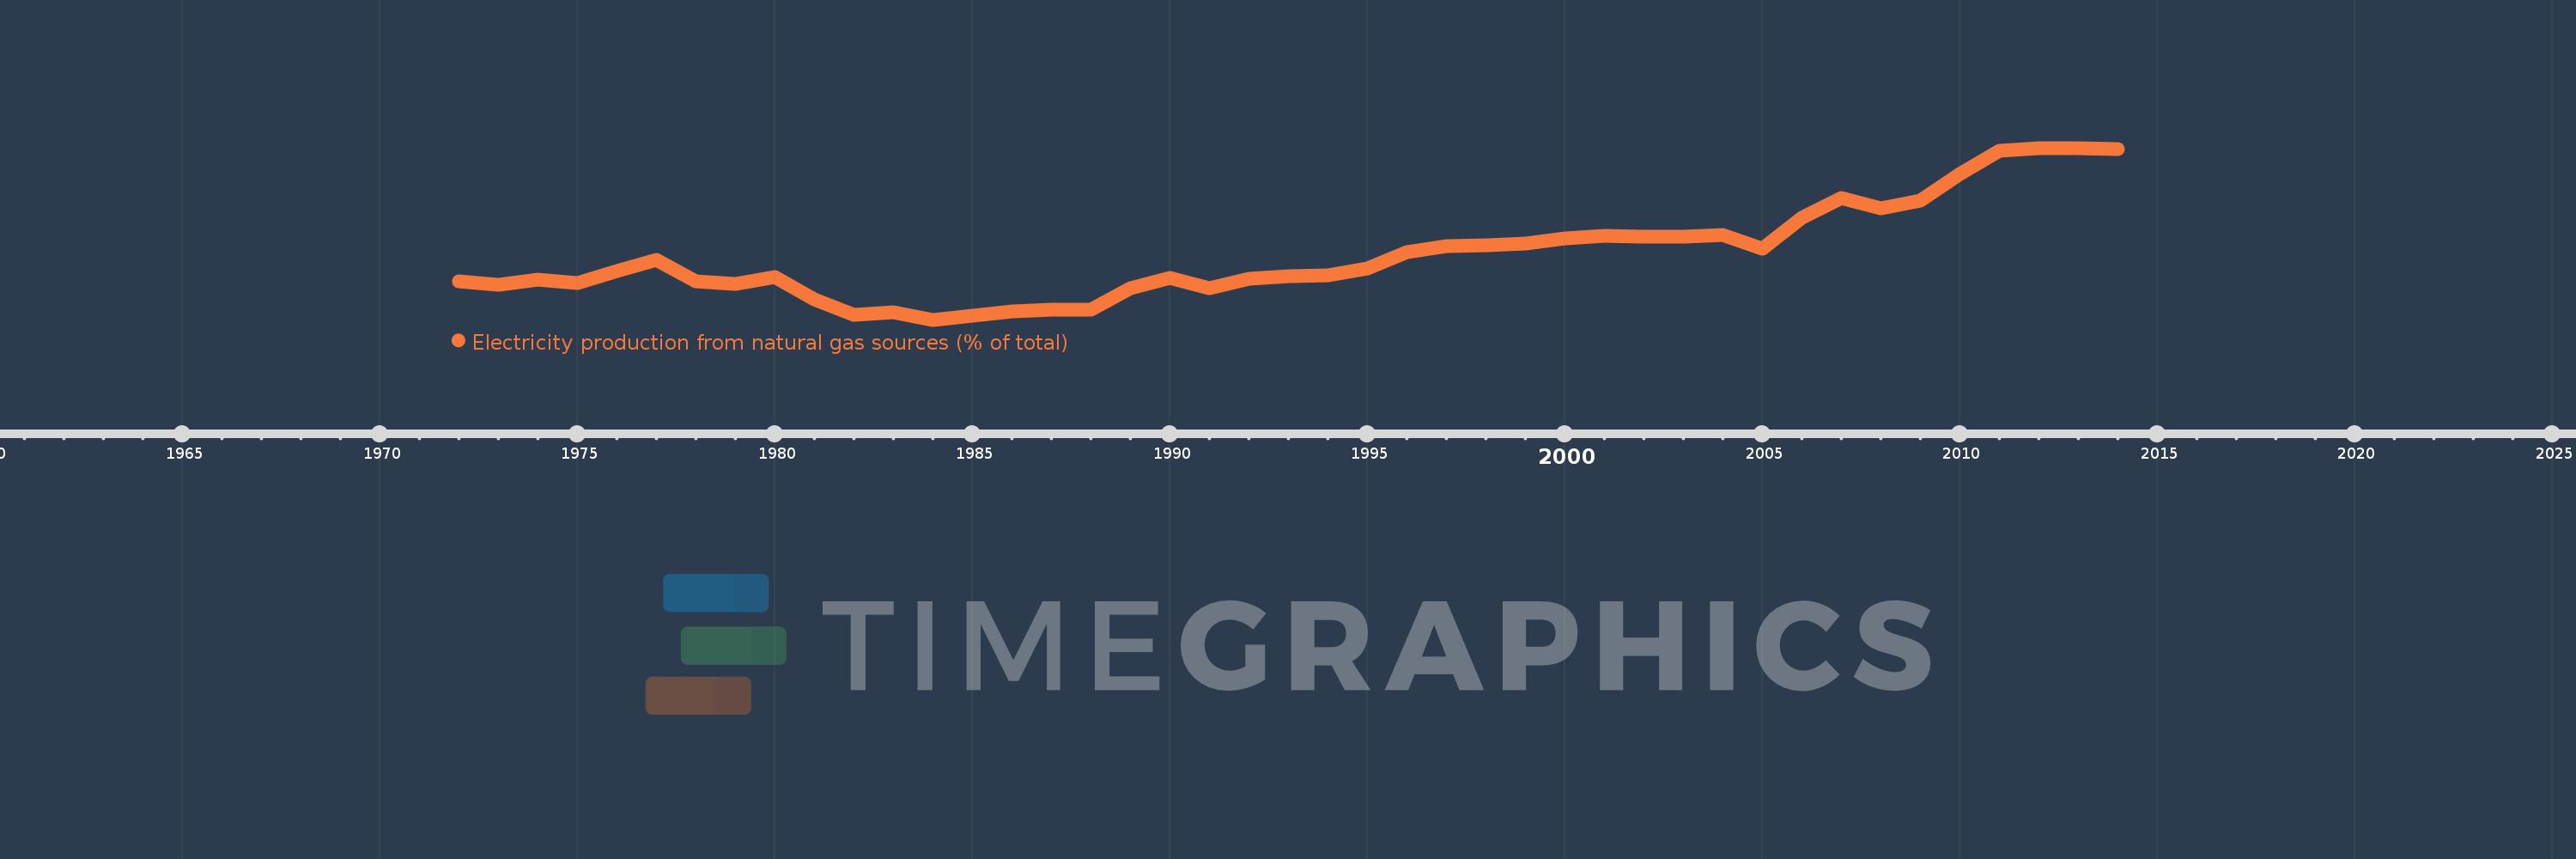
Electricity production from natural gas sources (% of total)
2014,2013,2012,2011,2010,2009,2008,2007,2006,2005,2004,2003,2002,2001,2000,1999,1998,1997,1996,1995,1994,1993,1992,1991,1990,1989,1988,1987,1986,1985,1984,1983,1982,1981,1980,1979,1978,1977,1976,1975,1974,1973,1972
This statistics in other country:
AlbaniaAlgeriaAngolaArab WorldArgentinaArmeniaAustraliaAustriaAzerbaijanBahrainBangladeshBelarusBelgiumBeninBoliviaBosnia and HerzegovinaBotswanaBrazilBrunei DarussalamBulgariaCambodiaCameroonCanadaCentral Europe and the BalticsChileChinaColombiaCongo, Dem. Rep.Congo, Rep.Costa RicaCote d'IvoireCroatiaCubaCuracaoCyprusCzech RepublicDenmarkDominican RepublicEarly-demographic dividendEast Asia & PacificEast Asia & Pacific (excluding high income)East Asia & Pacific (IDA & IBRD countries)EcuadorEgypt, Arab Rep.El SalvadorEritreaEstoniaEthiopiaEuro areaEurope & Central AsiaEurope & Central Asia (excluding high income)Europe & Central Asia (IDA & IBRD countries)European UnionFinlandFragile and conflict affected situationsFranceGabonGeorgiaGermanyGhanaGibraltarGreeceGuatemalaHaitiHeavily indebted poor countries (HIPC)High incomeHondurasHong Kong SAR, ChinaHungaryIBRD onlyIcelandIDA & IBRD totalIDA blendIDA onlyIDA totalIndiaIndonesiaIran, Islamic Rep.IraqIrelandIsraelItalyJamaicaJapanJordanKazakhstanKenyaKorea, Dem. People’s Rep.Korea, Rep.KosovoKuwaitKyrgyz RepublicLate-demographic dividendLatin America & Caribbean Latin America & Caribbean (excluding high income)Latin America & the Caribbean (IDA & IBRD countries)LatviaLeast developed countries: UN classificationLebanonLibyaLithuaniaLow & middle incomeLower middle incomeLuxembourgMacedonia, FYRMalaysiaMaltaMauritiusMexicoMiddle East & North AfricaMiddle East & North Africa (excluding high income)Middle East & North Africa (IDA & IBRD countries)Middle incomeMoldovaMongoliaMontenegroMoroccoMozambiqueMyanmarNamibiaNepalNetherlandsNew ZealandNicaraguaNigerNigeriaNorth AmericaNorwayOECD membersOmanOther small statesPakistanPanamaParaguayPeruPhilippinesPolandPortugalPost-demographic dividendPre-demographic dividendQatarRomaniaRussian FederationSaudi ArabiaSenegalSerbiaSingaporeSlovak RepublicSloveniaSmall statesSouth AfricaSouth AsiaSouth Asia (IDA & IBRD)South SudanSpainSri LankaSub-Saharan Africa Sub-Saharan Africa (excluding high income)Sub-Saharan Africa (IDA & IBRD countries)SudanSwedenSwitzerlandSyrian Arab RepublicTajikistanTanzaniaThailandTogoTrinidad and TobagoTunisiaTurkeyTurkmenistanUkraineUnited Arab EmiratesUnited KingdomUnited StatesUpper middle incomeUruguayUzbekistanVenezuela, RBVietnamWorldYemen, Rep.ZambiaZimbabwe Timeline:
This timeline shows a graph from 1972 to 2014 of Fragile and conflict affected situations. No data until 1971. Number of actual observations by date: 43.
Source name:
World Development Indicators
Source organization:
IEA Statistics © OECD/IEA 2014 (http://www.iea.org/stats/index.asp), subject to https://www.iea.org/t&c/termsandconditions/
Categories, topics:
Energy & Mining, Climate Change, Infrastructure
Last updated:
apr 23, 2017
Indicators value changes by year
Maximum:
34.677
jan 1, 2012
At the date of observation
Value
Absolute change
Change from previous value
jan 1, 1972
9.726
+9.726
0.0%
jan 1, 1973
9.007
-0.72
-7.4%
jan 1, 1974
10.041
+1.035
11.49%
jan 1, 1975
9.327
-0.714
-7.11%
jan 1, 1976
11.636
+2.309
24.76%
jan 1, 1977
13.605
+1.968
16.91%
jan 1, 1978
9.607
-3.998
-29.38%
jan 1, 1979
9.22
-0.387
-4.03%
jan 1, 1980
10.422
+1.202
13.04%
jan 1, 1981
6.268
-4.154
-39.86%
jan 1, 1982
3.38
-2.888
-46.08%
jan 1, 1983
3.914
+0.534
15.8%
jan 1, 1984
2.45
-1.463
-37.39%
jan 1, 1985
3.152
+0.702
28.65%
jan 1, 1986
4.007
+0.855
27.11%
jan 1, 1987
4.266
+0.26
6.48%
jan 1, 1988
4.338
+0.071
1.67%
jan 1, 1989
8.433
+4.095
94.41%
jan 1, 1990
10.269
+1.836
21.78%
jan 1, 1991
8.407
-1.862
-18.13%
jan 1, 1992
10.151
+1.743
20.74%
jan 1, 1993
10.604
+0.454
4.47%
jan 1, 1994
10.805
+0.201
1.89%
jan 1, 1995
12.024
+1.219
11.28%
jan 1, 1996
15.205
+3.181
26.45%
jan 1, 1997
16.315
+1.11
7.3%
jan 1, 1998
16.496
+0.181
1.11%
jan 1, 1999
16.79
+0.294
1.78%
jan 1, 2000
17.692
+0.902
5.37%
jan 1, 2001
18.123
+0.431
2.44%
jan 1, 2002
18.092
-0.031
-0.17%
jan 1, 2003
17.999
-0.093
-0.51%
jan 1, 2004
18.383
+0.384
2.13%
jan 1, 2005
15.83
-2.553
-13.89%
jan 1, 2006
21.515
+5.685
35.92%
jan 1, 2007
25.281
+3.766
17.5%
jan 1, 2008
23.427
-1.854
-7.33%
jan 1, 2009
24.839
+1.412
6.03%
jan 1, 2010
29.734
+4.895
19.71%
jan 1, 2011
34.07
+4.336
14.58%
jan 1, 2012
34.677
+0.607
1.78%
jan 1, 2013
34.591
-0.086
-0.25%
jan 1, 2014
34.437
-0.154
-0.44%
Ranking of countries by current statistics by years


Comments: