29
/
en
AIzaSyAYiBZKx7MnpbEhh9jyipgxe19OcubqV5w
April 1, 2024
29767
Euro area
EMU
false
2
1
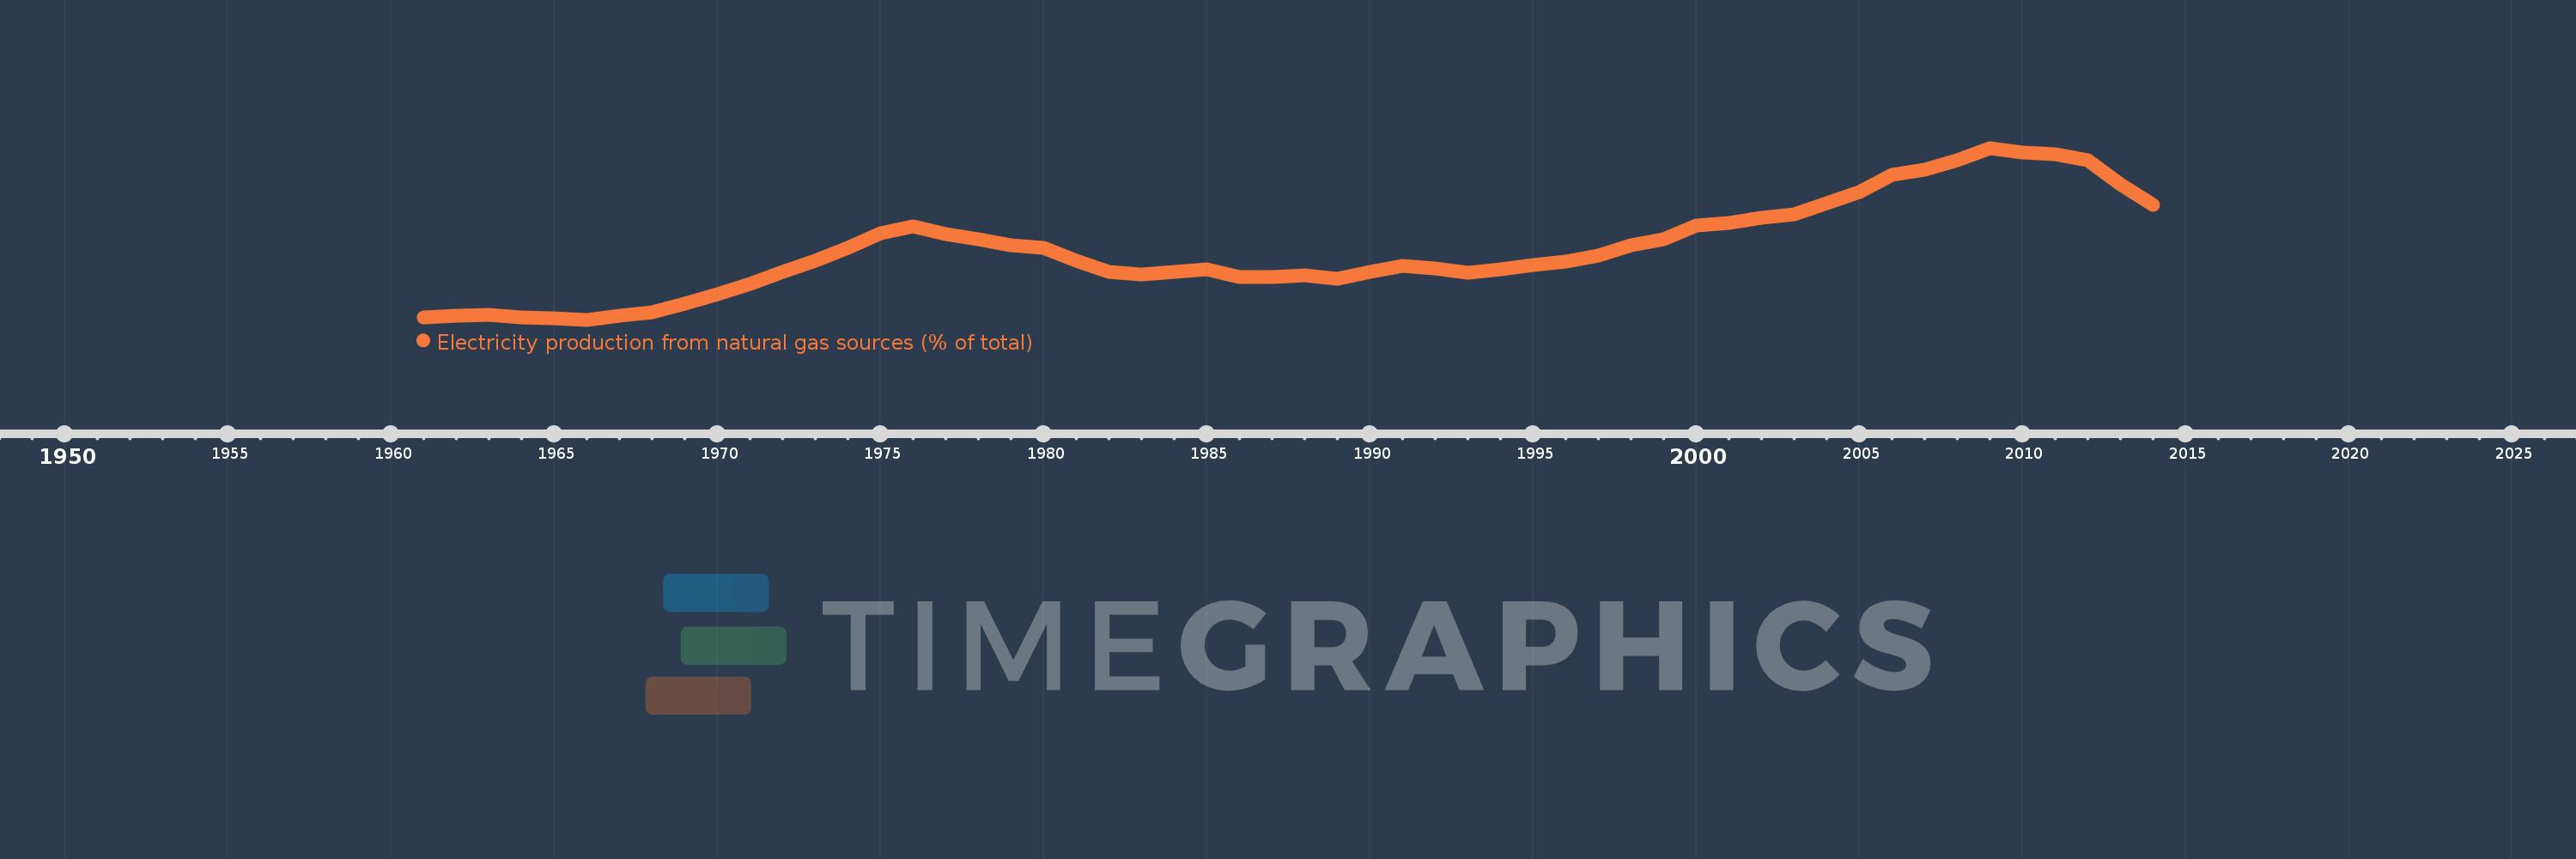
Electricity production from natural gas sources (% of total)
2014,2013,2012,2011,2010,2009,2008,2007,2006,2005,2004,2003,2002,2001,2000,1999,1998,1997,1996,1995,1994,1993,1992,1991,1990,1989,1988,1987,1986,1985,1984,1983,1982,1981,1980,1979,1978,1977,1976,1975,1974,1973,1972,1971,1970,1969,1968,1967,1966,1965,1964,1963,1962,1961
This statistics in other country:
AlbaniaAlgeriaAngolaArab WorldArgentinaArmeniaAustraliaAustriaAzerbaijanBahrainBangladeshBelarusBelgiumBeninBoliviaBosnia and HerzegovinaBotswanaBrazilBrunei DarussalamBulgariaCambodiaCameroonCanadaCentral Europe and the BalticsChileChinaColombiaCongo, Dem. Rep.Congo, Rep.Costa RicaCote d'IvoireCroatiaCubaCuracaoCyprusCzech RepublicDenmarkDominican RepublicEarly-demographic dividendEast Asia & PacificEast Asia & Pacific (excluding high income)East Asia & Pacific (IDA & IBRD countries)EcuadorEgypt, Arab Rep.El SalvadorEritreaEstoniaEthiopiaEuro areaEurope & Central AsiaEurope & Central Asia (excluding high income)Europe & Central Asia (IDA & IBRD countries)European UnionFinlandFragile and conflict affected situationsFranceGabonGeorgiaGermanyGhanaGibraltarGreeceGuatemalaHaitiHeavily indebted poor countries (HIPC)High incomeHondurasHong Kong SAR, ChinaHungaryIBRD onlyIcelandIDA & IBRD totalIDA blendIDA onlyIDA totalIndiaIndonesiaIran, Islamic Rep.IraqIrelandIsraelItalyJamaicaJapanJordanKazakhstanKenyaKorea, Dem. People’s Rep.Korea, Rep.KosovoKuwaitKyrgyz RepublicLate-demographic dividendLatin America & Caribbean Latin America & Caribbean (excluding high income)Latin America & the Caribbean (IDA & IBRD countries)LatviaLeast developed countries: UN classificationLebanonLibyaLithuaniaLow & middle incomeLower middle incomeLuxembourgMacedonia, FYRMalaysiaMaltaMauritiusMexicoMiddle East & North AfricaMiddle East & North Africa (excluding high income)Middle East & North Africa (IDA & IBRD countries)Middle incomeMoldovaMongoliaMontenegroMoroccoMozambiqueMyanmarNamibiaNepalNetherlandsNew ZealandNicaraguaNigerNigeriaNorth AmericaNorwayOECD membersOmanOther small statesPakistanPanamaParaguayPeruPhilippinesPolandPortugalPost-demographic dividendPre-demographic dividendQatarRomaniaRussian FederationSaudi ArabiaSenegalSerbiaSingaporeSlovak RepublicSloveniaSmall statesSouth AfricaSouth AsiaSouth Asia (IDA & IBRD)South SudanSpainSri LankaSub-Saharan Africa Sub-Saharan Africa (excluding high income)Sub-Saharan Africa (IDA & IBRD countries)SudanSwedenSwitzerlandSyrian Arab RepublicTajikistanTanzaniaThailandTogoTrinidad and TobagoTunisiaTurkeyTurkmenistanUkraineUnited Arab EmiratesUnited KingdomUnited StatesUpper middle incomeUruguayUzbekistanVenezuela, RBVietnamWorldYemen, Rep.ZambiaZimbabwe Timeline:
This timeline shows a graph from 1961 to 2014 of Euro area. No data until 1960. Number of actual observations by date: 54.
Source name:
World Development Indicators
Source organization:
IEA Statistics © OECD/IEA 2014 (http://www.iea.org/stats/index.asp), subject to https://www.iea.org/t&c/termsandconditions/
Categories, topics:
Energy & Mining, Climate Change, Infrastructure
Last updated:
apr 23, 2017
Indicators value changes by year
At the date of observation
Value
Absolute change
Change from previous value
jan 1, 1961
2.194
+2.194
0.0%
jan 1, 1962
2.445
+0.251
11.42%
jan 1, 1963
2.539
+0.095
3.87%
jan 1, 1964
2.284
-0.255
-10.05%
jan 1, 1965
2.118
-0.166
-7.25%
jan 1, 1966
1.932
-0.186
-8.78%
jan 1, 1967
2.474
+0.542
28.05%
jan 1, 1968
2.901
+0.426
17.24%
jan 1, 1969
4.019
+1.118
38.54%
jan 1, 1970
5.245
+1.226
30.5%
jan 1, 1971
6.571
+1.327
25.3%
jan 1, 1972
8.063
+1.492
22.7%
jan 1, 1973
9.513
+1.45
17.98%
jan 1, 1974
11.175
+1.663
17.48%
jan 1, 1975
13.051
+1.876
16.78%
jan 1, 1976
13.882
+0.831
6.37%
jan 1, 1977
12.907
-0.975
-7.02%
jan 1, 1978
12.196
-0.711
-5.51%
jan 1, 1979
11.423
-0.773
-6.34%
jan 1, 1980
11.134
-0.289
-2.53%
jan 1, 1981
9.449
-1.686
-15.14%
jan 1, 1982
8.053
-1.396
-14.77%
jan 1, 1983
7.766
-0.287
-3.57%
jan 1, 1984
8.068
+0.302
3.89%
jan 1, 1985
8.444
+0.376
4.66%
jan 1, 1986
7.352
-1.092
-12.93%
jan 1, 1987
7.368
+0.017
0.23%
jan 1, 1988
7.585
+0.216
2.94%
jan 1, 1989
7.232
-0.353
-4.65%
jan 1, 1990
8.04
+0.808
11.18%
jan 1, 1991
8.844
+0.804
9.99%
jan 1, 1992
8.494
-0.35
-3.96%
jan 1, 1993
7.976
-0.517
-6.09%
jan 1, 1994
8.381
+0.404
5.07%
jan 1, 1995
8.95
+0.57
6.8%
jan 1, 1996
9.342
+0.392
4.38%
jan 1, 1997
10.157
+0.815
8.72%
jan 1, 1998
11.497
+1.34
13.2%
jan 1, 1999
12.28
+0.783
6.81%
jan 1, 2000
13.957
+1.677
13.65%
jan 1, 2001
14.346
+0.389
2.79%
jan 1, 2002
14.977
+0.631
4.4%
jan 1, 2003
15.402
+0.425
2.83%
jan 1, 2004
16.919
+1.517
9.85%
jan 1, 2005
18.26
+1.341
7.93%
jan 1, 2006
20.526
+2.266
12.41%
jan 1, 2007
21.14
+0.613
2.99%
jan 1, 2008
22.315
+1.176
5.56%
jan 1, 2009
23.94
+1.625
7.28%
jan 1, 2010
23.395
-0.545
-2.28%
jan 1, 2011
23.131
-0.264
-1.13%
jan 1, 2012
22.321
-0.81
-3.5%
jan 1, 2013
19.318
-3.003
-13.45%
jan 1, 2014
16.654
-2.664
-13.79%
Ranking of countries by current statistics by years


Comments: