29
/
en
AIzaSyAYiBZKx7MnpbEhh9jyipgxe19OcubqV5w
April 1, 2024
52719
OECD members
OED
false
2
1
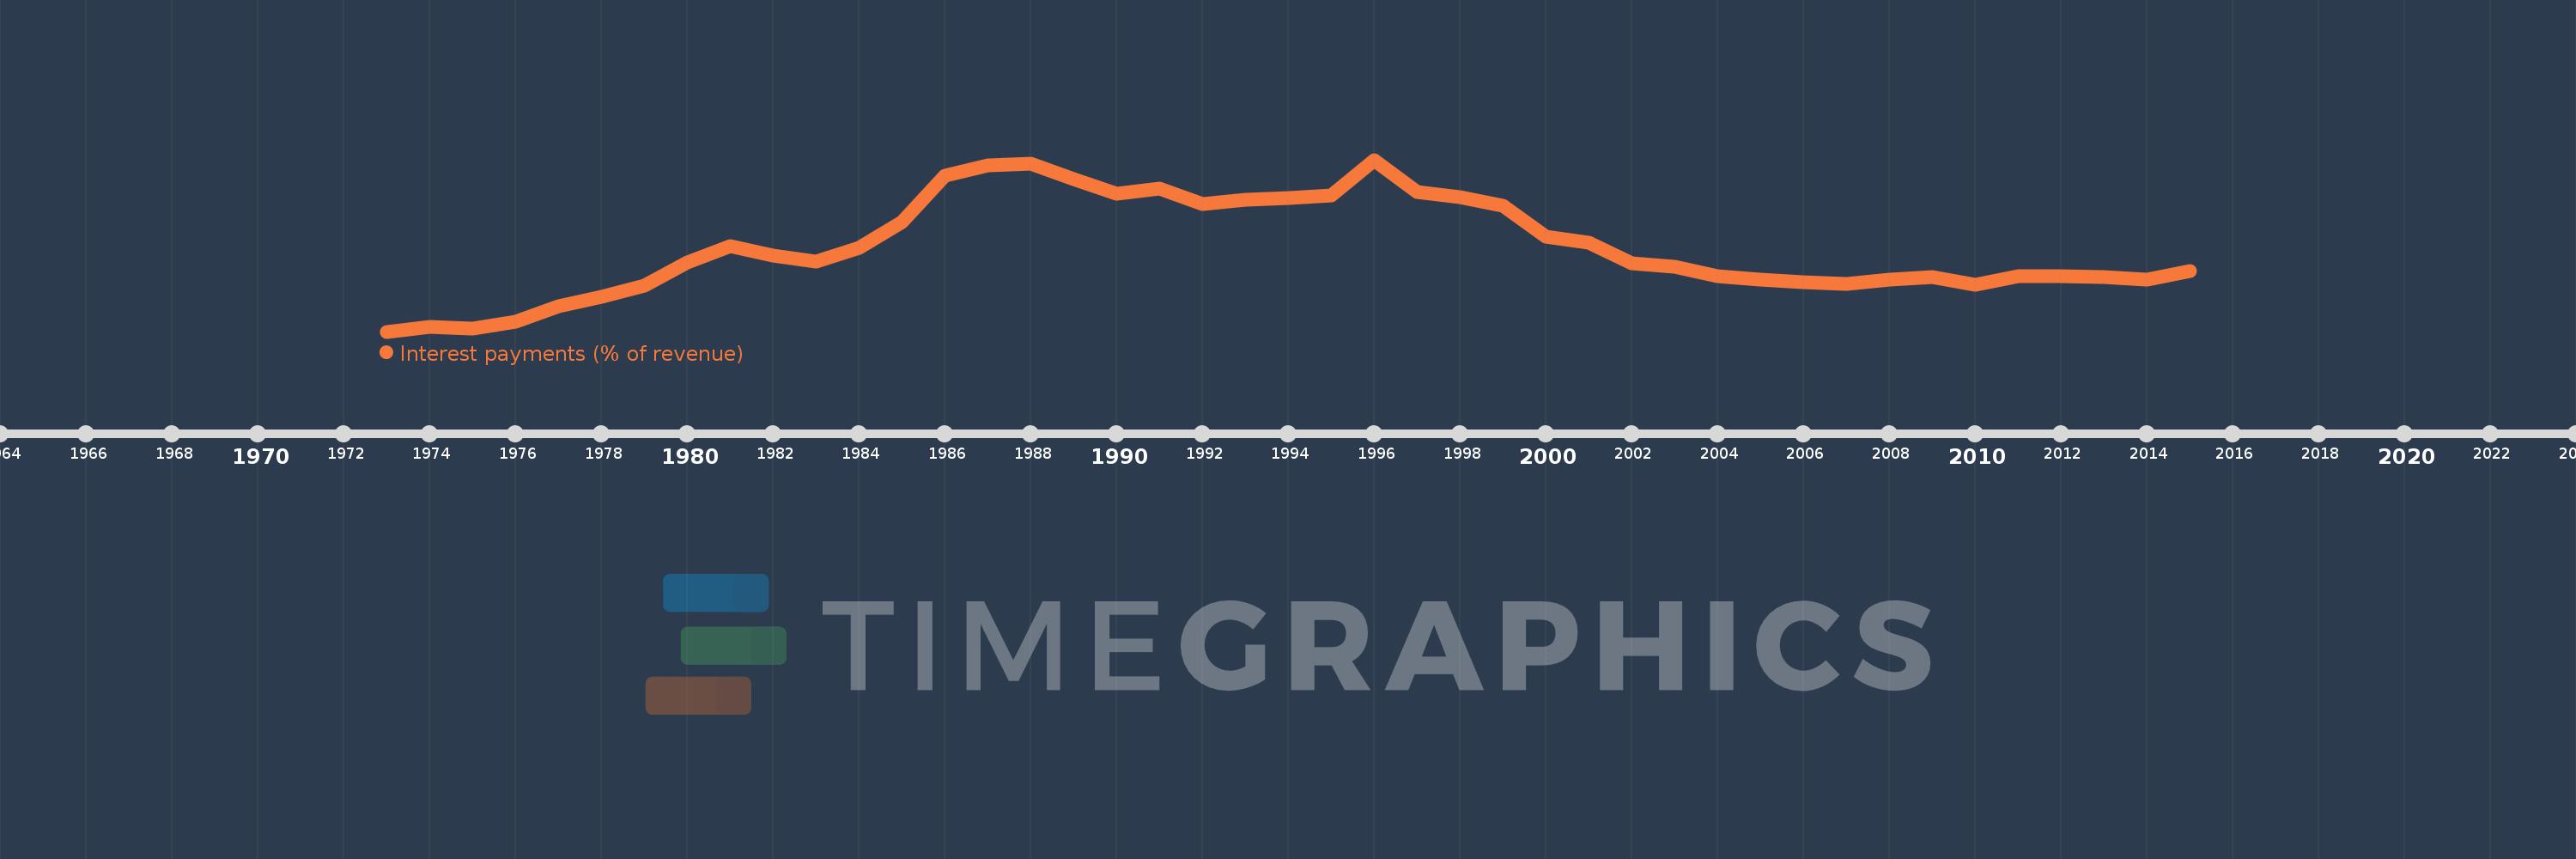
Interest payments (% of revenue)
2015,2014,2013,2012,2011,2010,2009,2008,2007,2006,2005,2004,2003,2002,2001,2000,1999,1998,1997,1996,1995,1994,1993,1992,1991,1990,1989,1988,1987,1986,1985,1984,1983,1982,1981,1980,1979,1978,1977,1976,1975,1974,1973
This statistics in other country:
AfghanistanAlbaniaAlgeriaAngolaAntigua and BarbudaArab WorldArmeniaAustraliaAustriaAzerbaijanBahamas, TheBahrainBangladeshBarbadosBelarusBelgiumBelizeBeninBhutanBoliviaBosnia and HerzegovinaBotswanaBrazilBulgariaBurkina FasoBurundiCabo VerdeCambodiaCanadaCaribbean small statesCentral African RepublicCentral Europe and the BalticsChileChinaColombiaCongo, Dem. Rep.Congo, Rep.Costa RicaCote d'IvoireCroatiaCyprusCzech RepublicDenmarkDominicaDominican RepublicEarly-demographic dividendEast Asia & PacificEast Asia & Pacific (excluding high income)East Asia & Pacific (IDA & IBRD countries)Egypt, Arab Rep.El SalvadorEquatorial GuineaEstoniaEthiopiaEuro areaEurope & Central AsiaEurope & Central Asia (excluding high income)Europe & Central Asia (IDA & IBRD countries)European UnionFijiFinlandFranceGambia, TheGeorgiaGermanyGhanaGreeceGrenadaGuatemalaHeavily indebted poor countries (HIPC)High incomeHondurasHong Kong SAR, ChinaHungaryIBRD onlyIcelandIDA & IBRD totalIDA blendIDA onlyIDA totalIndiaIndonesiaIran, Islamic Rep.IraqIrelandIsraelItalyJamaicaJapanJordanKazakhstanKenyaKiribatiKorea, Rep.KuwaitKyrgyz RepublicLao PDRLate-demographic dividendLatin America & Caribbean Latin America & Caribbean (excluding high income)Latin America & the Caribbean (IDA & IBRD countries)LatviaLeast developed countries: UN classificationLebanonLesothoLiberiaLithuaniaLow & middle incomeLow incomeLower middle incomeLuxembourgMacao SAR, ChinaMacedonia, FYRMadagascarMalawiMalaysiaMaldivesMaliMaltaMauritiusMexicoMicronesia, Fed. Sts.Middle East & North AfricaMiddle East & North Africa (excluding high income)Middle East & North Africa (IDA & IBRD countries)Middle incomeMoldovaMongoliaMoroccoMozambiqueNamibiaNepalNetherlandsNew ZealandNicaraguaNigeriaNorth AmericaNorwayOECD membersOmanOther small statesPakistanPanamaPapua New GuineaParaguayPeruPhilippinesPolandPortugalPost-demographic dividendPre-demographic dividendQatarRomaniaRussian FederationRwandaSamoaSan MarinoSao Tome and PrincipeSenegalSerbiaSeychellesSierra LeoneSingaporeSlovak RepublicSloveniaSmall statesSolomon IslandsSouth AfricaSouth AsiaSouth Asia (IDA & IBRD)SpainSri LankaSt. Kitts and NevisSt. LuciaSub-Saharan Africa Sub-Saharan Africa (excluding high income)Sub-Saharan Africa (IDA & IBRD countries)SurinameSwazilandSwedenSwitzerlandSyrian Arab RepublicTajikistanTanzaniaThailandTimor-LesteTogoTrinidad and TobagoTunisiaTurkeyUgandaUkraineUnited KingdomUnited StatesUpper middle incomeUruguayVanuatuVenezuela, RBVietnamWest Bank and GazaWorldYemen, Rep.ZambiaZimbabwe Timeline:
This timeline shows a graph from 1973 to 2015 of OECD members. No data until 1972. Number of actual observations by date: 43.
Source name:
World Development Indicators
Source organization:
International Monetary Fund, Government Finance Statistics Yearbook and data files.
Categories, topics:
Public Sector
Last updated:
apr 23, 2017
Indicators value changes by year
Maximum:
11.709
jan 1, 1996
At the date of observation
Value
Absolute change
Change from previous value
jan 1, 1973
3.079
+3.079
0.0%
jan 1, 1974
3.31
+0.231
7.51%
jan 1, 1975
3.212
-0.098
-2.97%
jan 1, 1976
3.574
+0.362
11.26%
jan 1, 1977
4.346
+0.772
21.6%
jan 1, 1978
4.847
+0.501
11.54%
jan 1, 1979
5.391
+0.543
11.21%
jan 1, 1980
6.569
+1.178
21.86%
jan 1, 1981
7.362
+0.793
12.07%
jan 1, 1982
6.889
-0.473
-6.42%
jan 1, 1983
6.603
-0.287
-4.16%
jan 1, 1984
7.293
+0.69
10.46%
jan 1, 1985
8.564
+1.271
17.43%
jan 1, 1986
10.925
+2.36
27.56%
jan 1, 1987
11.441
+0.516
4.73%
jan 1, 1988
11.534
+0.093
0.81%
jan 1, 1989
10.722
-0.812
-7.04%
jan 1, 1990
9.996
-0.726
-6.77%
jan 1, 1991
10.283
+0.287
2.87%
jan 1, 1992
9.48
-0.803
-7.81%
jan 1, 1993
9.686
+0.206
2.18%
jan 1, 1994
9.785
+0.099
1.02%
jan 1, 1995
9.934
+0.15
1.53%
jan 1, 1996
11.709
+1.774
17.86%
jan 1, 1997
10.097
-1.611
-13.76%
jan 1, 1998
9.83
-0.267
-2.64%
jan 1, 1999
9.392
-0.439
-4.46%
jan 1, 2000
7.85
-1.542
-16.42%
jan 1, 2001
7.524
-0.325
-4.15%
jan 1, 2002
6.518
-1.006
-13.37%
jan 1, 2003
6.354
-0.164
-2.52%
jan 1, 2004
5.845
-0.509
-8.01%
jan 1, 2005
5.693
-0.152
-2.59%
jan 1, 2006
5.543
-0.15
-2.64%
jan 1, 2007
5.488
-0.054
-0.98%
jan 1, 2008
5.696
+0.208
3.79%
jan 1, 2009
5.822
+0.126
2.21%
jan 1, 2010
5.446
-0.376
-6.46%
jan 1, 2011
5.85
+0.403
7.4%
jan 1, 2012
5.875
+0.025
0.43%
jan 1, 2013
5.822
-0.053
-0.9%
jan 1, 2014
5.696
-0.126
-2.16%
jan 1, 2015
6.105
+0.409
7.18%
Ranking of countries by current statistics by years


Comments: