29
/
en
AIzaSyAYiBZKx7MnpbEhh9jyipgxe19OcubqV5w
April 1, 2024
119061
Denmark
DNK
true
2
1
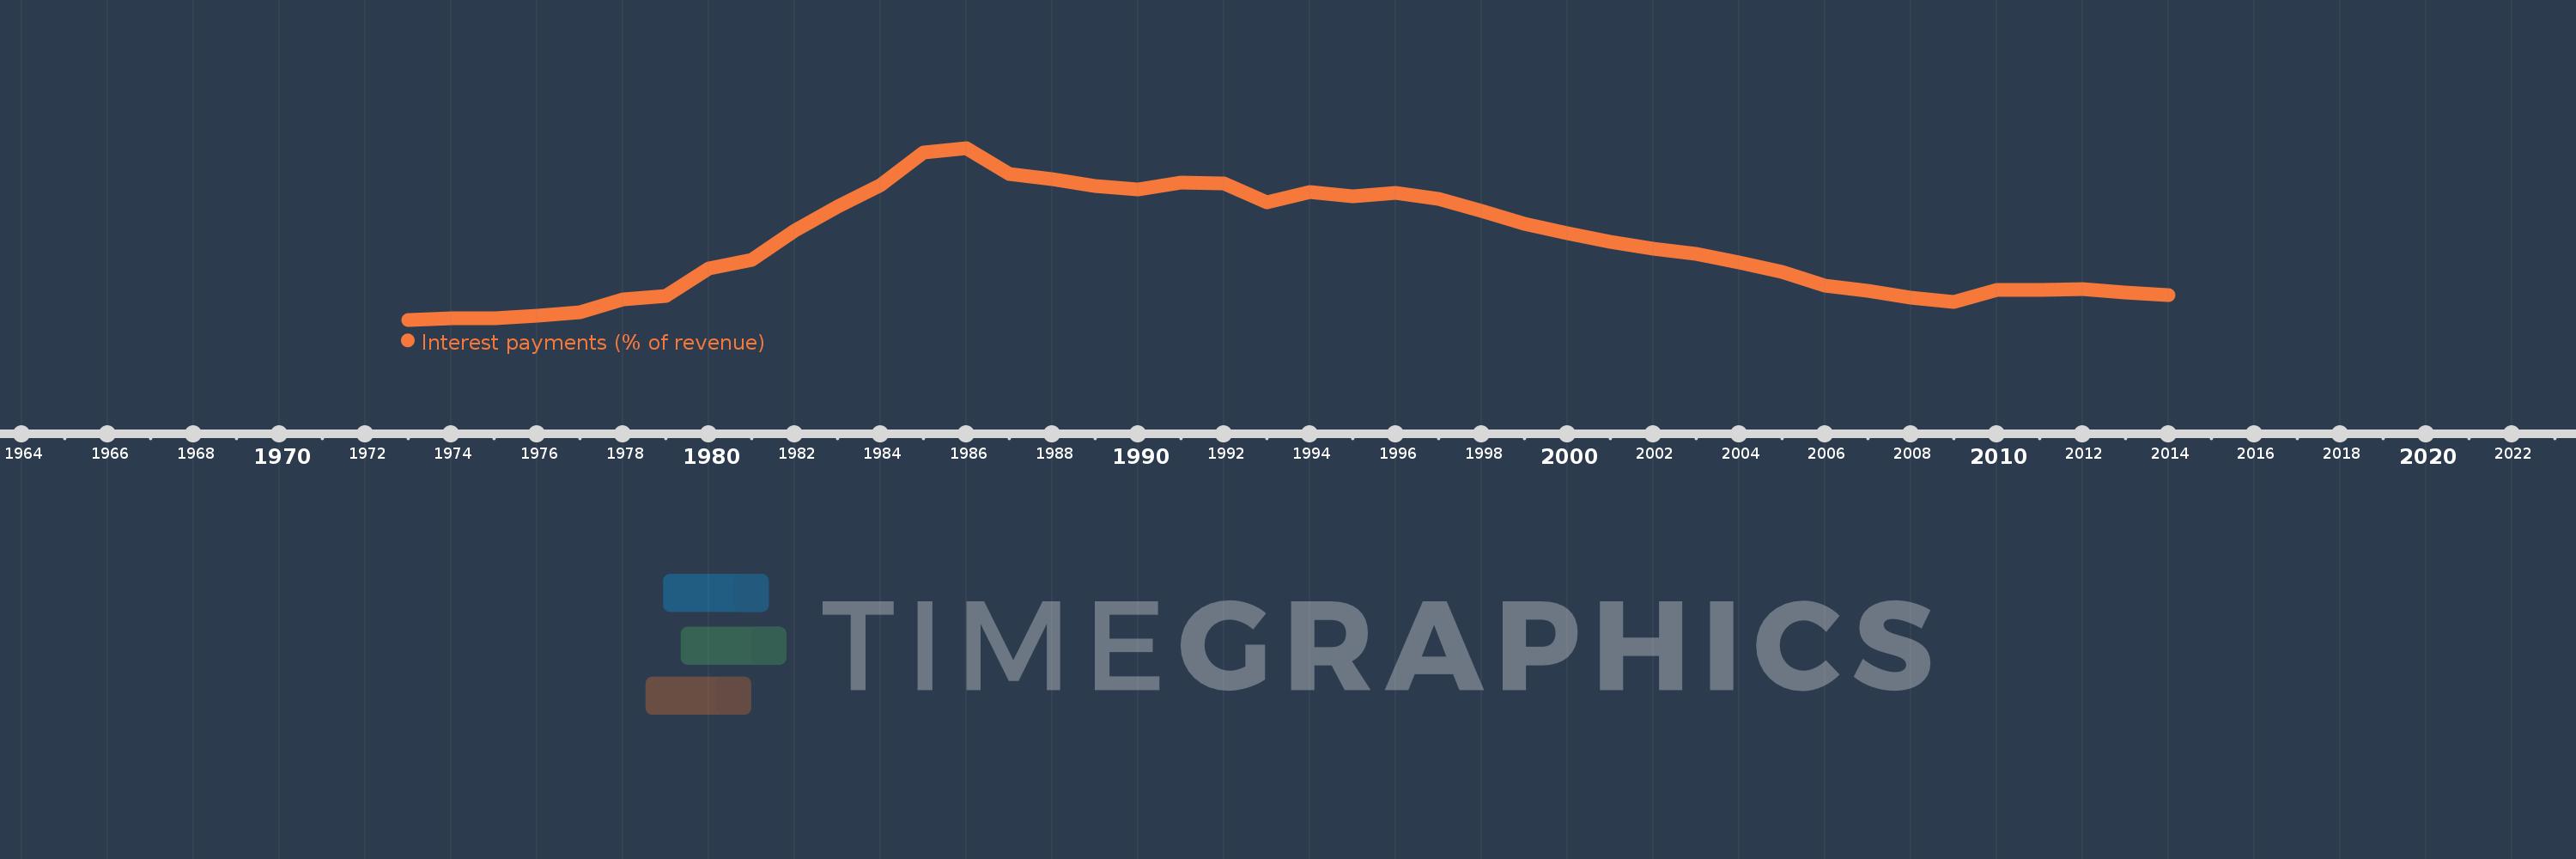
Interest payments (% of revenue)
2014,2013,2012,2011,2010,2009,2008,2007,2006,2005,2004,2003,2002,2001,2000,1999,1998,1997,1996,1995,1994,1993,1992,1991,1990,1989,1988,1987,1986,1985,1984,1983,1982,1981,1980,1979,1978,1977,1976,1975,1974,1973
This statistics in other country:
AfghanistanAlbaniaAlgeriaAngolaAntigua and BarbudaArab WorldArmeniaAustraliaAustriaAzerbaijanBahamas, TheBahrainBangladeshBarbadosBelarusBelgiumBelizeBeninBhutanBoliviaBosnia and HerzegovinaBotswanaBrazilBulgariaBurkina FasoBurundiCabo VerdeCambodiaCanadaCaribbean small statesCentral African RepublicCentral Europe and the BalticsChileChinaColombiaCongo, Dem. Rep.Congo, Rep.Costa RicaCote d'IvoireCroatiaCyprusCzech RepublicDenmarkDominicaDominican RepublicEarly-demographic dividendEast Asia & PacificEast Asia & Pacific (excluding high income)East Asia & Pacific (IDA & IBRD countries)Egypt, Arab Rep.El SalvadorEquatorial GuineaEstoniaEthiopiaEuro areaEurope & Central AsiaEurope & Central Asia (excluding high income)Europe & Central Asia (IDA & IBRD countries)European UnionFijiFinlandFranceGambia, TheGeorgiaGermanyGhanaGreeceGrenadaGuatemalaHeavily indebted poor countries (HIPC)High incomeHondurasHong Kong SAR, ChinaHungaryIBRD onlyIcelandIDA & IBRD totalIDA blendIDA onlyIDA totalIndiaIndonesiaIran, Islamic Rep.IraqIrelandIsraelItalyJamaicaJapanJordanKazakhstanKenyaKiribatiKorea, Rep.KuwaitKyrgyz RepublicLao PDRLate-demographic dividendLatin America & Caribbean Latin America & Caribbean (excluding high income)Latin America & the Caribbean (IDA & IBRD countries)LatviaLeast developed countries: UN classificationLebanonLesothoLiberiaLithuaniaLow & middle incomeLow incomeLower middle incomeLuxembourgMacao SAR, ChinaMacedonia, FYRMadagascarMalawiMalaysiaMaldivesMaliMaltaMauritiusMexicoMicronesia, Fed. Sts.Middle East & North AfricaMiddle East & North Africa (excluding high income)Middle East & North Africa (IDA & IBRD countries)Middle incomeMoldovaMongoliaMoroccoMozambiqueNamibiaNepalNetherlandsNew ZealandNicaraguaNigeriaNorth AmericaNorwayOECD membersOmanOther small statesPakistanPanamaPapua New GuineaParaguayPeruPhilippinesPolandPortugalPost-demographic dividendPre-demographic dividendQatarRomaniaRussian FederationRwandaSamoaSan MarinoSao Tome and PrincipeSenegalSerbiaSeychellesSierra LeoneSingaporeSlovak RepublicSloveniaSmall statesSolomon IslandsSouth AfricaSouth AsiaSouth Asia (IDA & IBRD)SpainSri LankaSt. Kitts and NevisSt. LuciaSub-Saharan Africa Sub-Saharan Africa (excluding high income)Sub-Saharan Africa (IDA & IBRD countries)SurinameSwazilandSwedenSwitzerlandSyrian Arab RepublicTajikistanTanzaniaThailandTimor-LesteTogoTrinidad and TobagoTunisiaTurkeyUgandaUkraineUnited KingdomUnited StatesUpper middle incomeUruguayVanuatuVenezuela, RBVietnamWest Bank and GazaWorldYemen, Rep.ZambiaZimbabwe Timeline:
This timeline shows a graph from 1973 to 2014 of Denmark. No data until 1972. Number of actual observations by date: 42.
Source name:
World Development Indicators
Source organization:
International Monetary Fund, Government Finance Statistics Yearbook and data files.
Categories, topics:
Public Sector
Last updated:
apr 23, 2017
Indicators value changes by year
Maximum:
19.057
jan 1, 1986
At the date of observation
Value
Absolute change
Change from previous value
jan 1, 1973
1.251
+1.251
0.0%
jan 1, 1974
1.371
+0.12
9.62%
jan 1, 1975
1.396
+0.025
1.81%
jan 1, 1976
1.651
+0.255
18.25%
jan 1, 1977
2.057
+0.407
24.63%
jan 1, 1978
3.4
+1.343
65.28%
jan 1, 1979
3.709
+0.309
9.07%
jan 1, 1980
6.563
+2.855
76.97%
jan 1, 1981
7.437
+0.874
13.31%
jan 1, 1982
10.52
+3.083
41.46%
jan 1, 1983
12.948
+2.427
23.07%
jan 1, 1984
15.169
+2.221
17.16%
jan 1, 1985
18.597
+3.428
22.6%
jan 1, 1986
19.057
+0.46
2.47%
jan 1, 1987
16.356
-2.702
-14.18%
jan 1, 1988
15.816
-0.54
-3.3%
jan 1, 1989
15.135
-0.68
-4.3%
jan 1, 1990
14.781
-0.354
-2.34%
jan 1, 1991
15.494
+0.713
4.82%
jan 1, 1992
15.401
-0.093
-0.6%
jan 1, 1993
13.442
-1.959
-12.72%
jan 1, 1994
14.521
+1.079
8.02%
jan 1, 1995
14.015
-0.506
-3.48%
jan 1, 1996
14.419
+0.404
2.88%
jan 1, 1997
13.773
-0.646
-4.48%
jan 1, 1998
12.557
-1.216
-8.83%
jan 1, 1999
11.23
-1.327
-10.57%
jan 1, 2000
10.243
-0.987
-8.79%
jan 1, 2001
9.313
-0.93
-9.08%
jan 1, 2002
8.646
-0.667
-7.16%
jan 1, 2003
8.054
-0.592
-6.85%
jan 1, 2004
7.207
-0.847
-10.51%
jan 1, 2005
6.197
-1.011
-14.02%
jan 1, 2006
4.792
-1.405
-22.68%
jan 1, 2007
4.227
-0.565
-11.79%
jan 1, 2008
3.527
-0.7
-16.56%
jan 1, 2009
3.07
-0.457
-12.95%
jan 1, 2010
4.346
+1.275
41.54%
jan 1, 2011
4.383
+0.037
0.86%
jan 1, 2012
4.455
+0.072
1.65%
jan 1, 2013
4.084
-0.371
-8.32%
jan 1, 2014
3.835
-0.249
-6.1%
Ranking of countries by current statistics by years


Comments: