29
/
en
AIzaSyAYiBZKx7MnpbEhh9jyipgxe19OcubqV5w
April 1, 2024
222356
Peru
PER
true
2
1
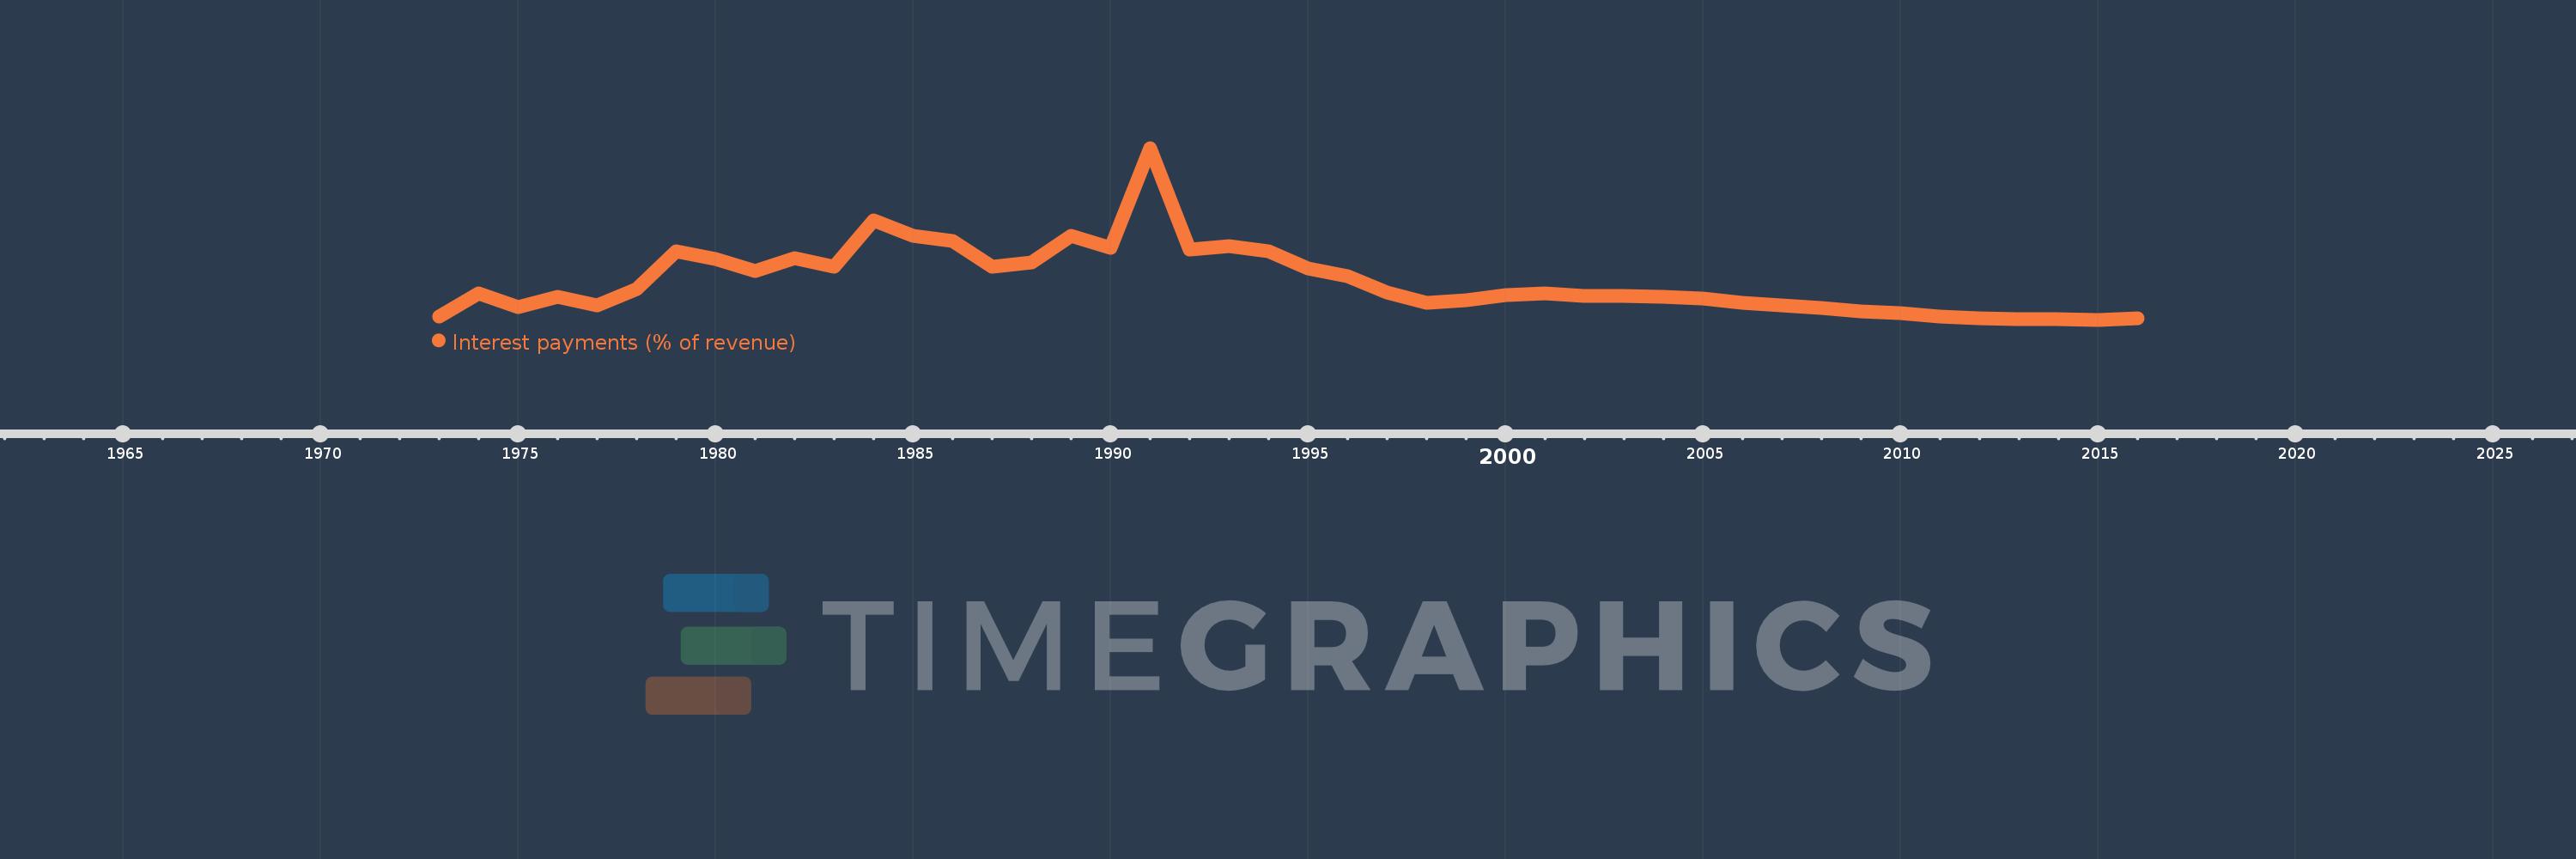
Interest payments (% of revenue)
2016,2015,2014,2013,2012,2011,2010,2009,2008,2007,2006,2005,2004,2003,2002,2001,2000,1999,1998,1997,1996,1995,1994,1993,1992,1991,1990,1989,1988,1987,1986,1985,1984,1983,1982,1981,1980,1979,1978,1977,1976,1975,1974,1973
This statistics in other country:
AfghanistanAlbaniaAlgeriaAngolaAntigua and BarbudaArab WorldArmeniaAustraliaAustriaAzerbaijanBahamas, TheBahrainBangladeshBarbadosBelarusBelgiumBelizeBeninBhutanBoliviaBosnia and HerzegovinaBotswanaBrazilBulgariaBurkina FasoBurundiCabo VerdeCambodiaCanadaCaribbean small statesCentral African RepublicCentral Europe and the BalticsChileChinaColombiaCongo, Dem. Rep.Congo, Rep.Costa RicaCote d'IvoireCroatiaCyprusCzech RepublicDenmarkDominicaDominican RepublicEarly-demographic dividendEast Asia & PacificEast Asia & Pacific (excluding high income)East Asia & Pacific (IDA & IBRD countries)Egypt, Arab Rep.El SalvadorEquatorial GuineaEstoniaEthiopiaEuro areaEurope & Central AsiaEurope & Central Asia (excluding high income)Europe & Central Asia (IDA & IBRD countries)European UnionFijiFinlandFranceGambia, TheGeorgiaGermanyGhanaGreeceGrenadaGuatemalaHeavily indebted poor countries (HIPC)High incomeHondurasHong Kong SAR, ChinaHungaryIBRD onlyIcelandIDA & IBRD totalIDA blendIDA onlyIDA totalIndiaIndonesiaIran, Islamic Rep.IraqIrelandIsraelItalyJamaicaJapanJordanKazakhstanKenyaKiribatiKorea, Rep.KuwaitKyrgyz RepublicLao PDRLate-demographic dividendLatin America & Caribbean Latin America & Caribbean (excluding high income)Latin America & the Caribbean (IDA & IBRD countries)LatviaLeast developed countries: UN classificationLebanonLesothoLiberiaLithuaniaLow & middle incomeLow incomeLower middle incomeLuxembourgMacao SAR, ChinaMacedonia, FYRMadagascarMalawiMalaysiaMaldivesMaliMaltaMauritiusMexicoMicronesia, Fed. Sts.Middle East & North AfricaMiddle East & North Africa (excluding high income)Middle East & North Africa (IDA & IBRD countries)Middle incomeMoldovaMongoliaMoroccoMozambiqueNamibiaNepalNetherlandsNew ZealandNicaraguaNigeriaNorth AmericaNorwayOECD membersOmanOther small statesPakistanPanamaPapua New GuineaParaguayPeruPhilippinesPolandPortugalPost-demographic dividendPre-demographic dividendQatarRomaniaRussian FederationRwandaSamoaSan MarinoSao Tome and PrincipeSenegalSerbiaSeychellesSierra LeoneSingaporeSlovak RepublicSloveniaSmall statesSolomon IslandsSouth AfricaSouth AsiaSouth Asia (IDA & IBRD)SpainSri LankaSt. Kitts and NevisSt. LuciaSub-Saharan Africa Sub-Saharan Africa (excluding high income)Sub-Saharan Africa (IDA & IBRD countries)SurinameSwazilandSwedenSwitzerlandSyrian Arab RepublicTajikistanTanzaniaThailandTimor-LesteTogoTrinidad and TobagoTunisiaTurkeyUgandaUkraineUnited KingdomUnited StatesUpper middle incomeUruguayVanuatuVenezuela, RBVietnamWest Bank and GazaWorldYemen, Rep.ZambiaZimbabwe Timeline:
This timeline shows a graph from 1973 to 2016 of Peru. No data until 1972. Number of actual observations by date: 44.
Source name:
World Development Indicators
Source organization:
International Monetary Fund, Government Finance Statistics Yearbook and data files.
Categories, topics:
Public Sector
Last updated:
apr 23, 2017
Indicators value changes by year
Maximum:
61.611
jan 1, 1991
At the date of observation
Value
Absolute change
Change from previous value
jan 1, 1973
5.769
+5.769
0.0%
jan 1, 1974
13.462
+7.692
133.33%
jan 1, 1975
8.955
-4.506
-33.48%
jan 1, 1976
12.36
+3.404
38.01%
jan 1, 1977
9.649
-2.71
-21.93%
jan 1, 1978
15.094
+5.445
56.43%
jan 1, 1979
27.376
+12.282
81.37%
jan 1, 1980
25.045
-2.331
-8.51%
jan 1, 1981
21.001
-4.044
-16.15%
jan 1, 1982
25.082
+4.081
19.43%
jan 1, 1983
22.414
-2.668
-10.64%
jan 1, 1984
37.747
+15.333
68.41%
jan 1, 1985
32.489
-5.258
-13.93%
jan 1, 1986
30.866
-1.623
-5.0%
jan 1, 1987
22.272
-8.594
-27.84%
jan 1, 1988
23.901
+1.629
7.31%
jan 1, 1989
32.506
+8.605
36.0%
jan 1, 1990
28.47
-4.036
-12.42%
jan 1, 1991
61.611
+33.141
116.4%
jan 1, 1992
28.031
-33.58
-54.5%
jan 1, 1993
29.249
+1.219
4.35%
jan 1, 1994
27.537
-1.713
-5.86%
jan 1, 1995
21.779
-5.757
-20.91%
jan 1, 1996
19.236
-2.543
-11.68%
jan 1, 1997
13.737
-5.499
-28.59%
jan 1, 1998
10.443
-3.294
-23.98%
jan 1, 1999
11.292
+0.849
8.13%
jan 1, 2000
13.039
+1.747
15.47%
jan 1, 2001
13.501
+0.461
3.54%
jan 1, 2002
12.787
-0.714
-5.29%
jan 1, 2003
12.569
-0.218
-1.7%
jan 1, 2004
12.41
-0.159
-1.27%
jan 1, 2005
11.949
-0.461
-3.71%
jan 1, 2006
10.564
-1.385
-11.59%
jan 1, 2007
9.467
-1.097
-10.38%
jan 1, 2008
8.741
-0.726
-7.66%
jan 1, 2009
7.634
-1.108
-12.67%
jan 1, 2010
7.0
-0.634
-8.3%
jan 1, 2011
5.828
-1.172
-16.74%
jan 1, 2012
5.45
-0.378
-6.49%
jan 1, 2013
4.948
-0.502
-9.21%
jan 1, 2014
5.045
+0.097
1.96%
jan 1, 2015
4.832
-0.213
-4.22%
jan 1, 2016
5.192
+0.359
7.43%
Ranking of countries by current statistics by years


Comments: