29
/
en
AIzaSyAYiBZKx7MnpbEhh9jyipgxe19OcubqV5w
April 1, 2024
35849
High income
HIC
false
2
1
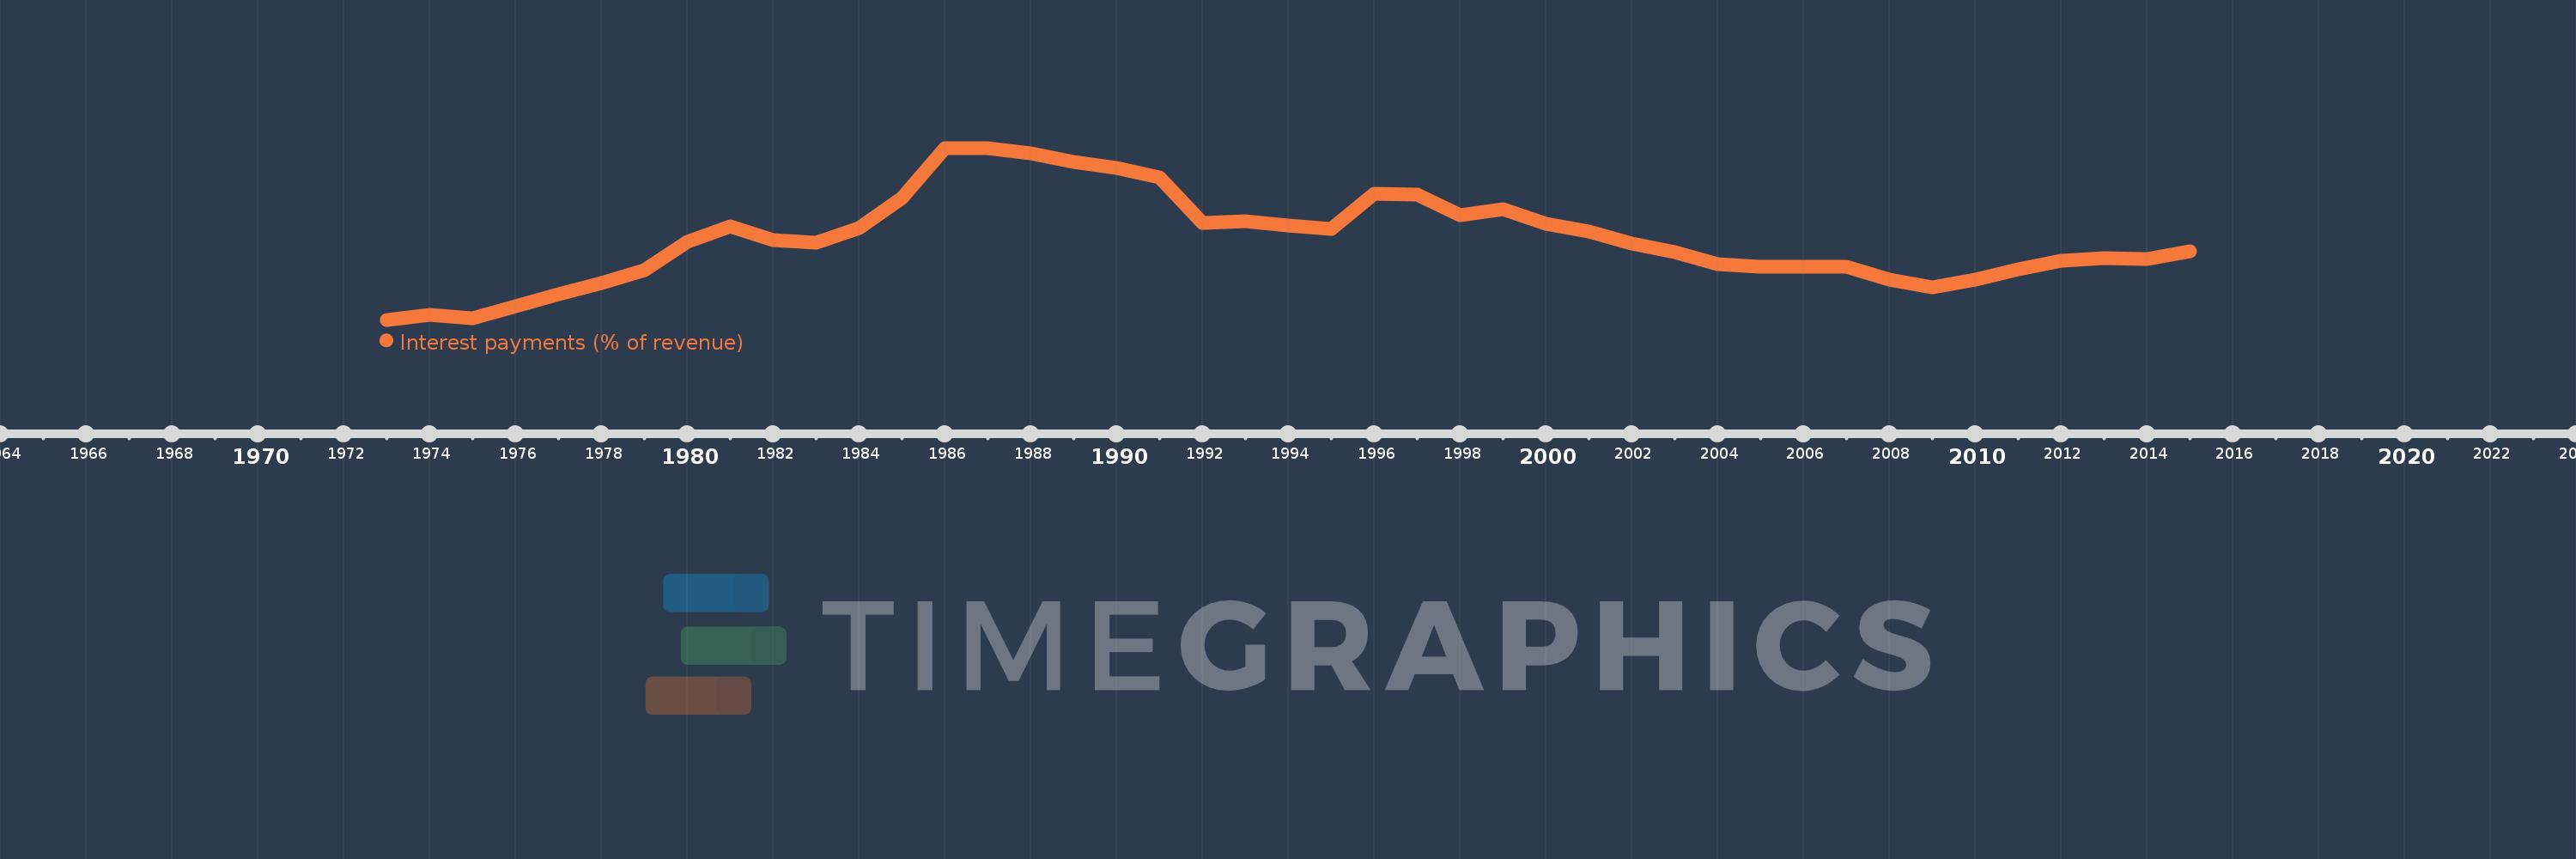
Interest payments (% of revenue)
2015,2014,2013,2012,2011,2010,2009,2008,2007,2006,2005,2004,2003,2002,2001,2000,1999,1998,1997,1996,1995,1994,1993,1992,1991,1990,1989,1988,1987,1986,1985,1984,1983,1982,1981,1980,1979,1978,1977,1976,1975,1974,1973
This statistics in other country:
AfghanistanAlbaniaAlgeriaAngolaAntigua and BarbudaArab WorldArmeniaAustraliaAustriaAzerbaijanBahamas, TheBahrainBangladeshBarbadosBelarusBelgiumBelizeBeninBhutanBoliviaBosnia and HerzegovinaBotswanaBrazilBulgariaBurkina FasoBurundiCabo VerdeCambodiaCanadaCaribbean small statesCentral African RepublicCentral Europe and the BalticsChileChinaColombiaCongo, Dem. Rep.Congo, Rep.Costa RicaCote d'IvoireCroatiaCyprusCzech RepublicDenmarkDominicaDominican RepublicEarly-demographic dividendEast Asia & PacificEast Asia & Pacific (excluding high income)East Asia & Pacific (IDA & IBRD countries)Egypt, Arab Rep.El SalvadorEquatorial GuineaEstoniaEthiopiaEuro areaEurope & Central AsiaEurope & Central Asia (excluding high income)Europe & Central Asia (IDA & IBRD countries)European UnionFijiFinlandFranceGambia, TheGeorgiaGermanyGhanaGreeceGrenadaGuatemalaHeavily indebted poor countries (HIPC)High incomeHondurasHong Kong SAR, ChinaHungaryIBRD onlyIcelandIDA & IBRD totalIDA blendIDA onlyIDA totalIndiaIndonesiaIran, Islamic Rep.IraqIrelandIsraelItalyJamaicaJapanJordanKazakhstanKenyaKiribatiKorea, Rep.KuwaitKyrgyz RepublicLao PDRLate-demographic dividendLatin America & Caribbean Latin America & Caribbean (excluding high income)Latin America & the Caribbean (IDA & IBRD countries)LatviaLeast developed countries: UN classificationLebanonLesothoLiberiaLithuaniaLow & middle incomeLow incomeLower middle incomeLuxembourgMacao SAR, ChinaMacedonia, FYRMadagascarMalawiMalaysiaMaldivesMaliMaltaMauritiusMexicoMicronesia, Fed. Sts.Middle East & North AfricaMiddle East & North Africa (excluding high income)Middle East & North Africa (IDA & IBRD countries)Middle incomeMoldovaMongoliaMoroccoMozambiqueNamibiaNepalNetherlandsNew ZealandNicaraguaNigeriaNorth AmericaNorwayOECD membersOmanOther small statesPakistanPanamaPapua New GuineaParaguayPeruPhilippinesPolandPortugalPost-demographic dividendPre-demographic dividendQatarRomaniaRussian FederationRwandaSamoaSan MarinoSao Tome and PrincipeSenegalSerbiaSeychellesSierra LeoneSingaporeSlovak RepublicSloveniaSmall statesSolomon IslandsSouth AfricaSouth AsiaSouth Asia (IDA & IBRD)SpainSri LankaSt. Kitts and NevisSt. LuciaSub-Saharan Africa Sub-Saharan Africa (excluding high income)Sub-Saharan Africa (IDA & IBRD countries)SurinameSwazilandSwedenSwitzerlandSyrian Arab RepublicTajikistanTanzaniaThailandTimor-LesteTogoTrinidad and TobagoTunisiaTurkeyUgandaUkraineUnited KingdomUnited StatesUpper middle incomeUruguayVanuatuVenezuela, RBVietnamWest Bank and GazaWorldYemen, Rep.ZambiaZimbabwe Timeline:
This timeline shows a graph from 1973 to 2015 of High income. No data until 1972. Number of actual observations by date: 43.
Source name:
World Development Indicators
Source organization:
International Monetary Fund, Government Finance Statistics Yearbook and data files.
Categories, topics:
Public Sector
Last updated:
apr 23, 2017
Indicators value changes by year
Maximum:
10.884
jan 1, 1987
At the date of observation
Value
Absolute change
Change from previous value
jan 1, 1973
2.97
+2.97
0.0%
jan 1, 1974
3.18
+0.21
7.06%
jan 1, 1975
3.021
-0.158
-4.98%
jan 1, 1976
3.574
+0.552
18.29%
jan 1, 1977
4.139
+0.565
15.82%
jan 1, 1978
4.67
+0.531
12.82%
jan 1, 1979
5.259
+0.589
12.61%
jan 1, 1980
6.563
+1.304
24.8%
jan 1, 1981
7.287
+0.724
11.03%
jan 1, 1982
6.644
-0.643
-8.83%
jan 1, 1983
6.503
-0.141
-2.12%
jan 1, 1984
7.177
+0.674
10.36%
jan 1, 1985
8.564
+1.387
19.33%
jan 1, 1986
10.859
+2.295
26.8%
jan 1, 1987
10.884
+0.025
0.23%
jan 1, 1988
10.629
-0.255
-2.35%
jan 1, 1989
10.241
-0.388
-3.65%
jan 1, 1990
9.967
-0.274
-2.68%
jan 1, 1991
9.541
-0.426
-4.28%
jan 1, 1992
7.414
-2.127
-22.29%
jan 1, 1993
7.501
+0.087
1.17%
jan 1, 1994
7.324
-0.177
-2.36%
jan 1, 1995
7.156
-0.168
-2.29%
jan 1, 1996
8.765
+1.608
22.47%
jan 1, 1997
8.735
-0.029
-0.34%
jan 1, 1998
7.8
-0.935
-10.71%
jan 1, 1999
8.058
+0.259
3.31%
jan 1, 2000
7.374
-0.684
-8.49%
jan 1, 2001
7.044
-0.33
-4.48%
jan 1, 2002
6.495
-0.549
-7.8%
jan 1, 2003
6.083
-0.412
-6.34%
jan 1, 2004
5.545
-0.537
-8.83%
jan 1, 2005
5.406
-0.139
-2.51%
jan 1, 2006
5.402
-0.004
-0.07%
jan 1, 2007
5.431
+0.029
0.53%
jan 1, 2008
4.816
-0.615
-11.32%
jan 1, 2009
4.464
-0.352
-7.31%
jan 1, 2010
4.829
+0.365
8.18%
jan 1, 2011
5.285
+0.456
9.44%
jan 1, 2012
5.684
+0.399
7.54%
jan 1, 2013
5.822
+0.138
2.43%
jan 1, 2014
5.757
-0.066
-1.13%
jan 1, 2015
6.105
+0.348
6.05%
Ranking of countries by current statistics by years


Comments: