29
/
en
AIzaSyAYiBZKx7MnpbEhh9jyipgxe19OcubqV5w
April 1, 2024
245760
South Africa
ZAF
true
2
1
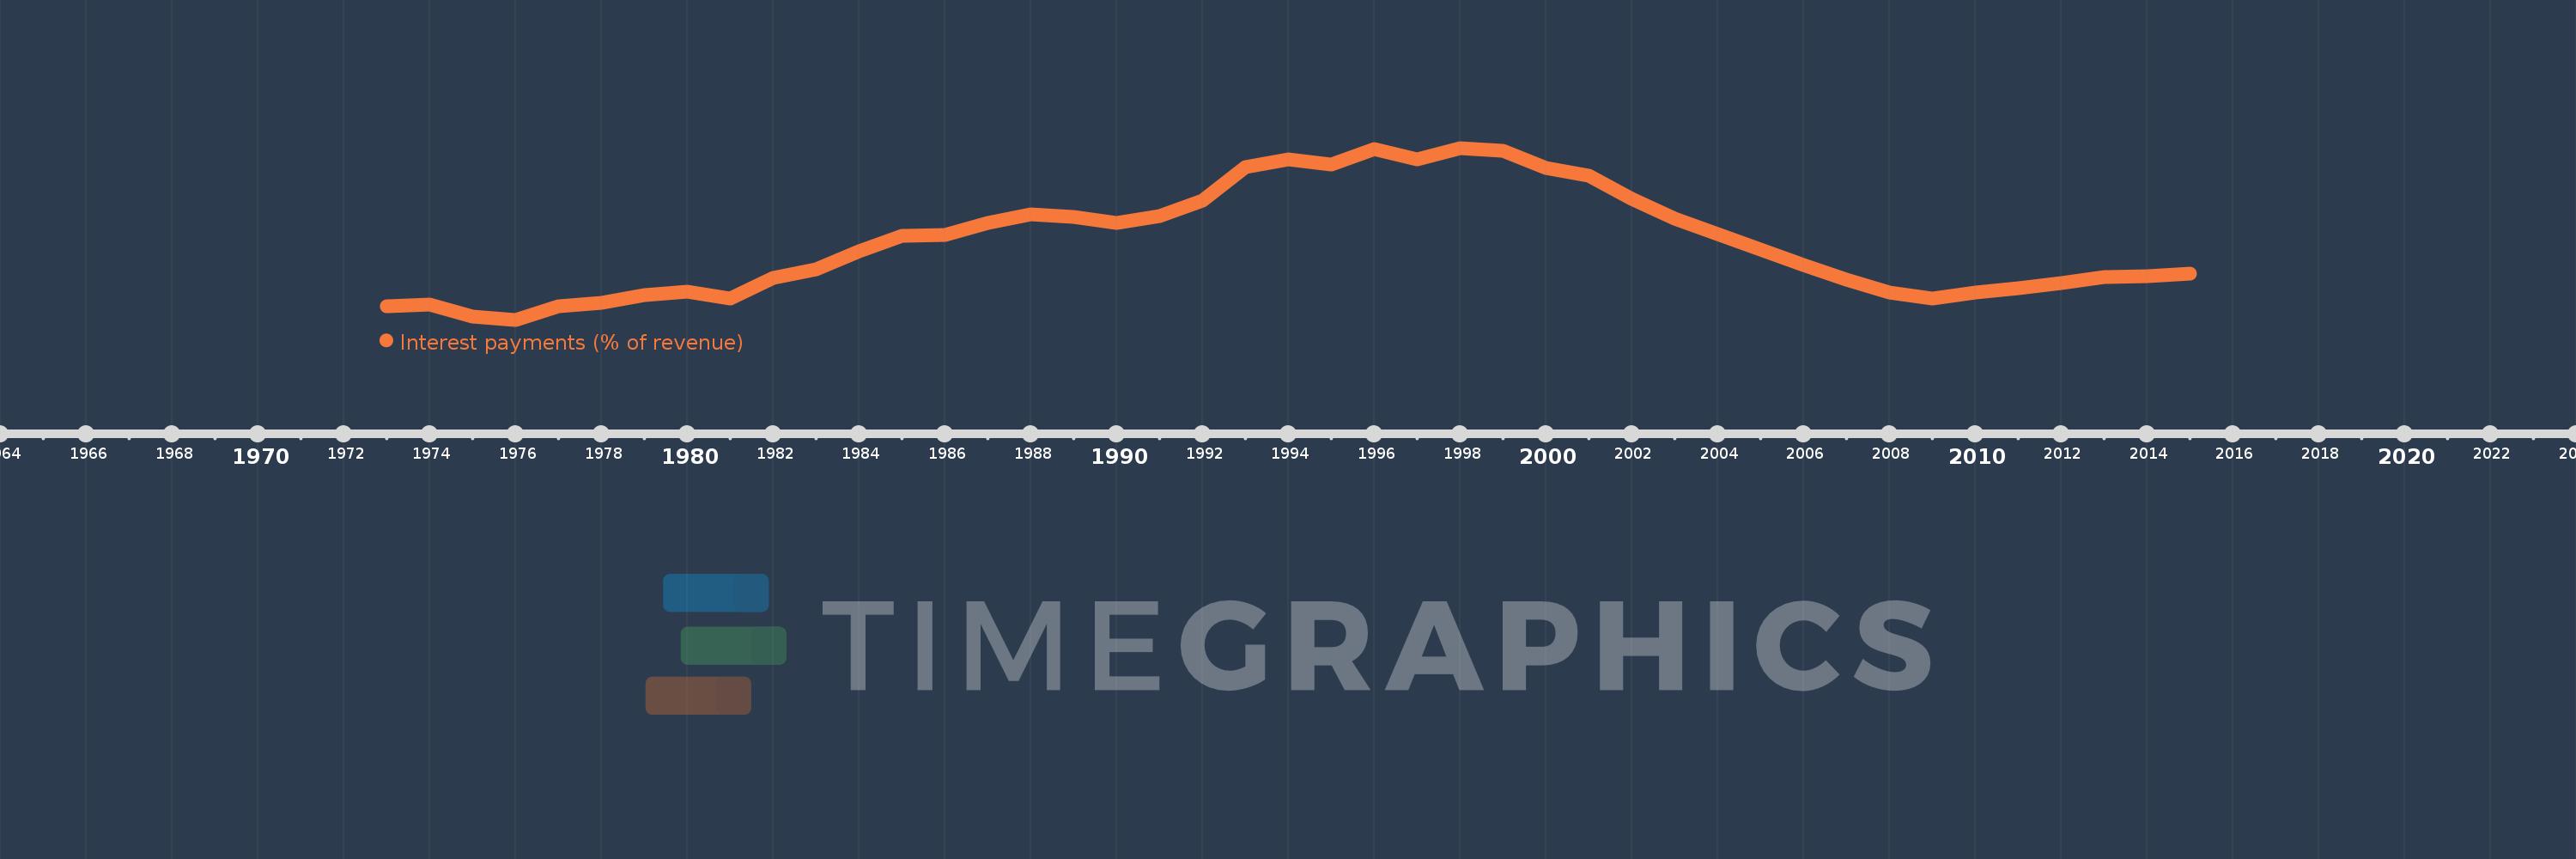
Interest payments (% of revenue)
2015,2014,2013,2012,2011,2010,2009,2008,2007,2006,2005,2004,2003,2002,2001,2000,1999,1998,1997,1996,1995,1994,1993,1992,1991,1990,1989,1988,1987,1986,1985,1984,1983,1982,1981,1980,1979,1978,1977,1976,1975,1974,1973
This statistics in other country:
AfghanistanAlbaniaAlgeriaAngolaAntigua and BarbudaArab WorldArmeniaAustraliaAustriaAzerbaijanBahamas, TheBahrainBangladeshBarbadosBelarusBelgiumBelizeBeninBhutanBoliviaBosnia and HerzegovinaBotswanaBrazilBulgariaBurkina FasoBurundiCabo VerdeCambodiaCanadaCaribbean small statesCentral African RepublicCentral Europe and the BalticsChileChinaColombiaCongo, Dem. Rep.Congo, Rep.Costa RicaCote d'IvoireCroatiaCyprusCzech RepublicDenmarkDominicaDominican RepublicEarly-demographic dividendEast Asia & PacificEast Asia & Pacific (excluding high income)East Asia & Pacific (IDA & IBRD countries)Egypt, Arab Rep.El SalvadorEquatorial GuineaEstoniaEthiopiaEuro areaEurope & Central AsiaEurope & Central Asia (excluding high income)Europe & Central Asia (IDA & IBRD countries)European UnionFijiFinlandFranceGambia, TheGeorgiaGermanyGhanaGreeceGrenadaGuatemalaHeavily indebted poor countries (HIPC)High incomeHondurasHong Kong SAR, ChinaHungaryIBRD onlyIcelandIDA & IBRD totalIDA blendIDA onlyIDA totalIndiaIndonesiaIran, Islamic Rep.IraqIrelandIsraelItalyJamaicaJapanJordanKazakhstanKenyaKiribatiKorea, Rep.KuwaitKyrgyz RepublicLao PDRLate-demographic dividendLatin America & Caribbean Latin America & Caribbean (excluding high income)Latin America & the Caribbean (IDA & IBRD countries)LatviaLeast developed countries: UN classificationLebanonLesothoLiberiaLithuaniaLow & middle incomeLow incomeLower middle incomeLuxembourgMacao SAR, ChinaMacedonia, FYRMadagascarMalawiMalaysiaMaldivesMaliMaltaMauritiusMexicoMicronesia, Fed. Sts.Middle East & North AfricaMiddle East & North Africa (excluding high income)Middle East & North Africa (IDA & IBRD countries)Middle incomeMoldovaMongoliaMoroccoMozambiqueNamibiaNepalNetherlandsNew ZealandNicaraguaNigeriaNorth AmericaNorwayOECD membersOmanOther small statesPakistanPanamaPapua New GuineaParaguayPeruPhilippinesPolandPortugalPost-demographic dividendPre-demographic dividendQatarRomaniaRussian FederationRwandaSamoaSan MarinoSao Tome and PrincipeSenegalSerbiaSeychellesSierra LeoneSingaporeSlovak RepublicSloveniaSmall statesSolomon IslandsSouth AfricaSouth AsiaSouth Asia (IDA & IBRD)SpainSri LankaSt. Kitts and NevisSt. LuciaSub-Saharan Africa Sub-Saharan Africa (excluding high income)Sub-Saharan Africa (IDA & IBRD countries)SurinameSwazilandSwedenSwitzerlandSyrian Arab RepublicTajikistanTanzaniaThailandTimor-LesteTogoTrinidad and TobagoTunisiaTurkeyUgandaUkraineUnited KingdomUnited StatesUpper middle incomeUruguayVanuatuVenezuela, RBVietnamWest Bank and GazaWorldYemen, Rep.ZambiaZimbabwe Timeline:
This timeline shows a graph from 1973 to 2015 of South Africa. No data until 1972. Number of actual observations by date: 43.
Source name:
World Development Indicators
Source organization:
International Monetary Fund, Government Finance Statistics Yearbook and data files.
Categories, topics:
Public Sector
Last updated:
apr 23, 2017
Indicators value changes by year
Maximum:
21.665
jan 1, 1998
At the date of observation
Value
Absolute change
Change from previous value
jan 1, 1973
7.041
+7.041
0.0%
jan 1, 1974
7.192
+0.151
2.15%
jan 1, 1975
6.042
-1.15
-15.99%
jan 1, 1976
5.762
-0.281
-4.65%
jan 1, 1977
6.988
+1.226
21.28%
jan 1, 1978
7.317
+0.329
4.71%
jan 1, 1979
8.039
+0.723
9.88%
jan 1, 1980
8.333
+0.294
3.66%
jan 1, 1981
7.744
-0.589
-7.07%
jan 1, 1982
9.611
+1.867
24.1%
jan 1, 1983
10.396
+0.786
8.17%
jan 1, 1984
12.104
+1.707
16.42%
jan 1, 1985
13.557
+1.453
12.01%
jan 1, 1986
13.619
+0.062
0.46%
jan 1, 1987
14.687
+1.068
7.84%
jan 1, 1988
15.546
+0.859
5.85%
jan 1, 1989
15.3
-0.247
-1.59%
jan 1, 1990
14.73
-0.57
-3.72%
jan 1, 1991
15.376
+0.646
4.39%
jan 1, 1992
16.772
+1.396
9.08%
jan 1, 1993
19.921
+3.149
18.77%
jan 1, 1994
20.584
+0.663
3.33%
jan 1, 1995
20.149
-0.435
-2.11%
jan 1, 1996
21.566
+1.418
7.04%
jan 1, 1997
20.633
-0.933
-4.33%
jan 1, 1998
21.665
+1.031
5.0%
jan 1, 1999
21.389
-0.276
-1.27%
jan 1, 2000
19.783
-1.606
-7.51%
jan 1, 2001
19.099
-0.684
-3.46%
jan 1, 2002
16.968
-2.13
-11.16%
jan 1, 2003
15.131
-1.837
-10.83%
jan 1, 2004
13.671
-1.46
-9.65%
jan 1, 2005
12.264
-1.408
-10.3%
jan 1, 2006
10.789
-1.474
-12.02%
jan 1, 2007
9.449
-1.34
-12.42%
jan 1, 2008
8.283
-1.166
-12.34%
jan 1, 2009
7.758
-0.524
-6.33%
jan 1, 2010
8.31
+0.551
7.11%
jan 1, 2011
8.676
+0.366
4.41%
jan 1, 2012
9.178
+0.502
5.79%
jan 1, 2013
9.746
+0.568
6.19%
jan 1, 2014
9.793
+0.047
0.48%
jan 1, 2015
10.069
+0.276
2.81%
Ranking of countries by current statistics by years


Comments: