29
/
en
AIzaSyAYiBZKx7MnpbEhh9jyipgxe19OcubqV5w
April 1, 2024
276798
United States
USA
true
2
1
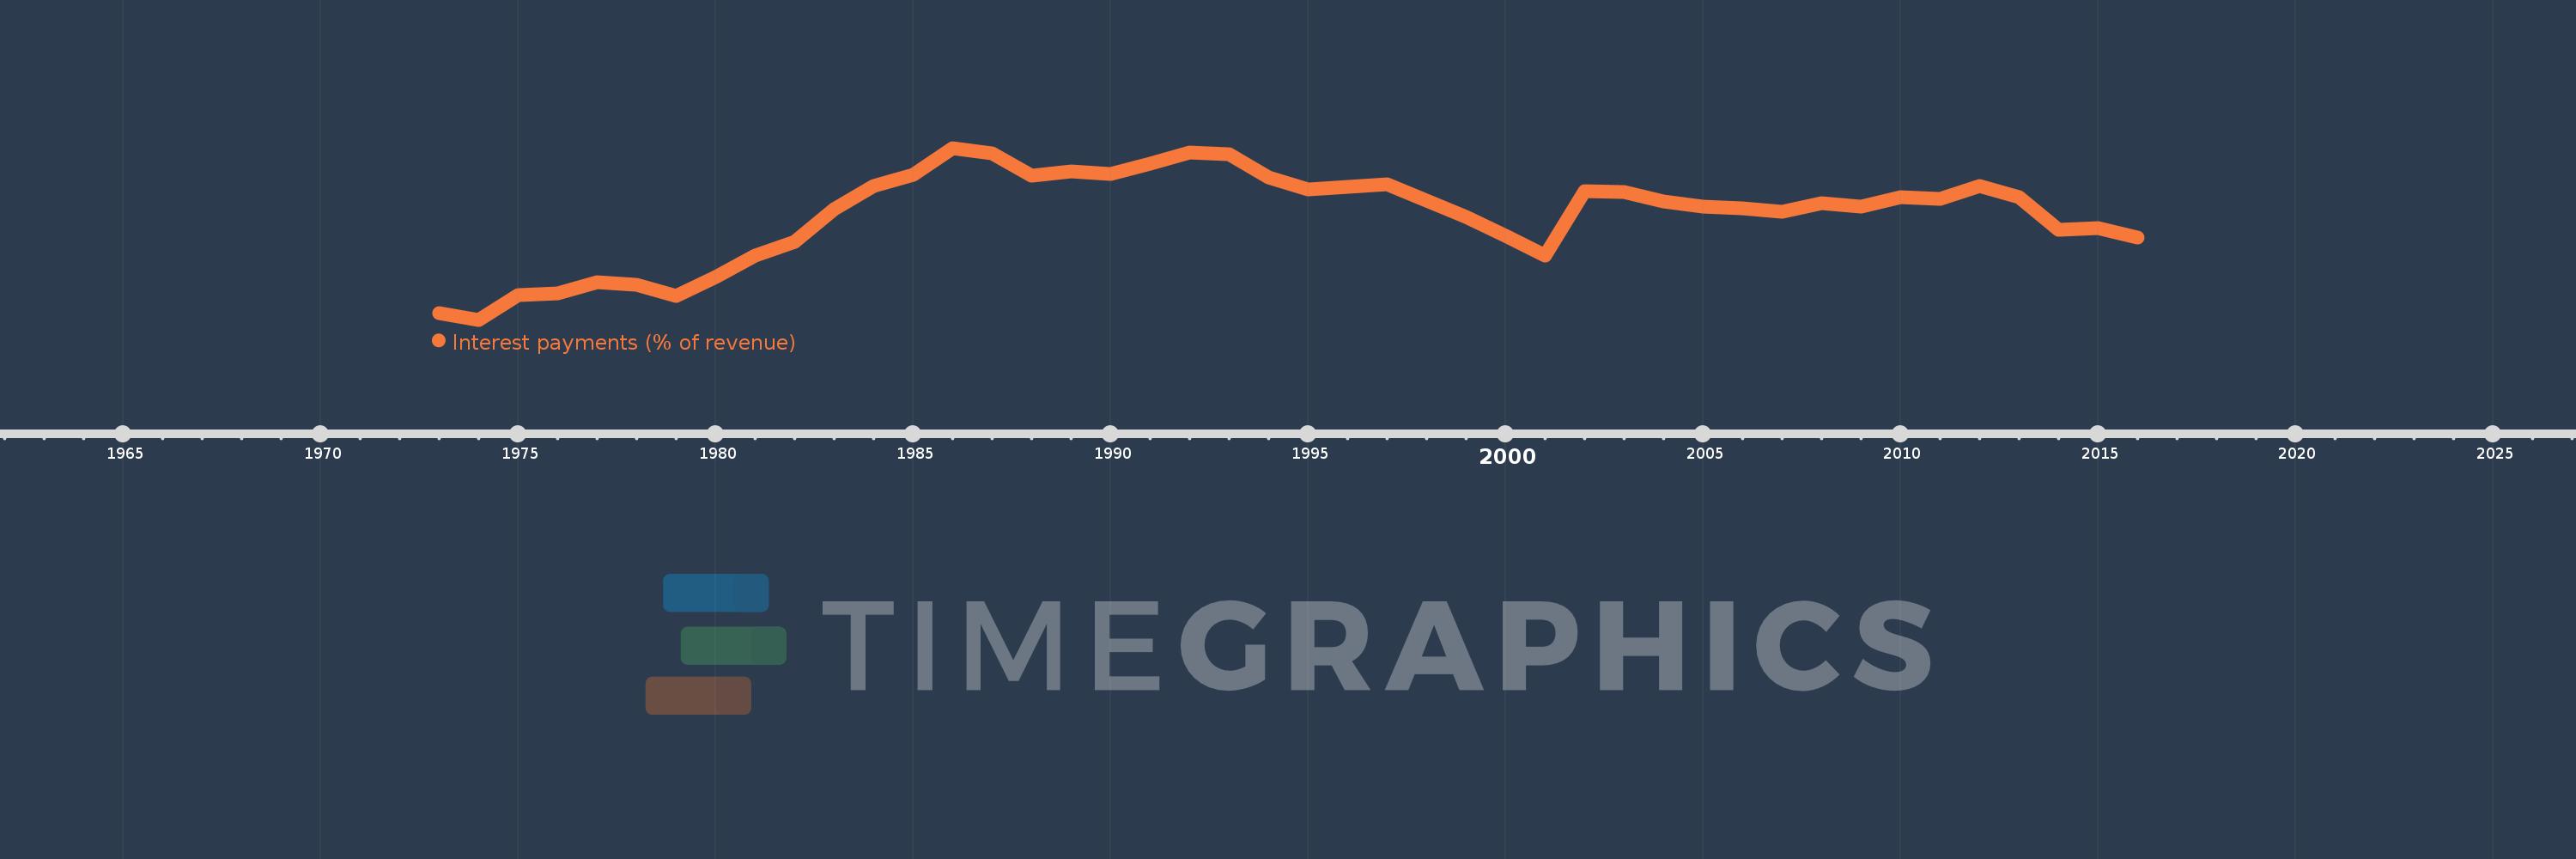
Interest payments (% of revenue)
2016,2015,2014,2013,2012,2011,2010,2009,2008,2007,2006,2005,2004,2003,2002,2001,2000,1999,1998,1997,1996,1995,1994,1993,1992,1991,1990,1989,1988,1987,1986,1985,1984,1983,1982,1981,1980,1979,1978,1977,1976,1975,1974,1973
This statistics in other country:
AfghanistanAlbaniaAlgeriaAngolaAntigua and BarbudaArab WorldArmeniaAustraliaAustriaAzerbaijanBahamas, TheBahrainBangladeshBarbadosBelarusBelgiumBelizeBeninBhutanBoliviaBosnia and HerzegovinaBotswanaBrazilBulgariaBurkina FasoBurundiCabo VerdeCambodiaCanadaCaribbean small statesCentral African RepublicCentral Europe and the BalticsChileChinaColombiaCongo, Dem. Rep.Congo, Rep.Costa RicaCote d'IvoireCroatiaCyprusCzech RepublicDenmarkDominicaDominican RepublicEarly-demographic dividendEast Asia & PacificEast Asia & Pacific (excluding high income)East Asia & Pacific (IDA & IBRD countries)Egypt, Arab Rep.El SalvadorEquatorial GuineaEstoniaEthiopiaEuro areaEurope & Central AsiaEurope & Central Asia (excluding high income)Europe & Central Asia (IDA & IBRD countries)European UnionFijiFinlandFranceGambia, TheGeorgiaGermanyGhanaGreeceGrenadaGuatemalaHeavily indebted poor countries (HIPC)High incomeHondurasHong Kong SAR, ChinaHungaryIBRD onlyIcelandIDA & IBRD totalIDA blendIDA onlyIDA totalIndiaIndonesiaIran, Islamic Rep.IraqIrelandIsraelItalyJamaicaJapanJordanKazakhstanKenyaKiribatiKorea, Rep.KuwaitKyrgyz RepublicLao PDRLate-demographic dividendLatin America & Caribbean Latin America & Caribbean (excluding high income)Latin America & the Caribbean (IDA & IBRD countries)LatviaLeast developed countries: UN classificationLebanonLesothoLiberiaLithuaniaLow & middle incomeLow incomeLower middle incomeLuxembourgMacao SAR, ChinaMacedonia, FYRMadagascarMalawiMalaysiaMaldivesMaliMaltaMauritiusMexicoMicronesia, Fed. Sts.Middle East & North AfricaMiddle East & North Africa (excluding high income)Middle East & North Africa (IDA & IBRD countries)Middle incomeMoldovaMongoliaMoroccoMozambiqueNamibiaNepalNetherlandsNew ZealandNicaraguaNigeriaNorth AmericaNorwayOECD membersOmanOther small statesPakistanPanamaPapua New GuineaParaguayPeruPhilippinesPolandPortugalPost-demographic dividendPre-demographic dividendQatarRomaniaRussian FederationRwandaSamoaSan MarinoSao Tome and PrincipeSenegalSerbiaSeychellesSierra LeoneSingaporeSlovak RepublicSloveniaSmall statesSolomon IslandsSouth AfricaSouth AsiaSouth Asia (IDA & IBRD)SpainSri LankaSt. Kitts and NevisSt. LuciaSub-Saharan Africa Sub-Saharan Africa (excluding high income)Sub-Saharan Africa (IDA & IBRD countries)SurinameSwazilandSwedenSwitzerlandSyrian Arab RepublicTajikistanTanzaniaThailandTimor-LesteTogoTrinidad and TobagoTunisiaTurkeyUgandaUkraineUnited KingdomUnited StatesUpper middle incomeUruguayVanuatuVenezuela, RBVietnamWest Bank and GazaWorldYemen, Rep.ZambiaZimbabwe Timeline:
This timeline shows a graph from 1973 to 2016 of United States. No data until 1972. Number of actual observations by date: 44.
Source name:
World Development Indicators
Source organization:
International Monetary Fund, Government Finance Statistics Yearbook and data files.
Categories, topics:
Public Sector
Last updated:
apr 23, 2017
Indicators value changes by year
Maximum:
19.229
jan 1, 1986
At the date of observation
Value
Absolute change
Change from previous value
jan 1, 1973
6.929
+6.929
0.0%
jan 1, 1974
6.428
-0.501
-7.23%
jan 1, 1975
8.285
+1.857
28.89%
jan 1, 1976
8.418
+0.133
1.61%
jan 1, 1977
9.227
+0.808
9.6%
jan 1, 1978
9.006
-0.221
-2.39%
jan 1, 1979
8.229
-0.777
-8.63%
jan 1, 1980
9.633
+1.404
17.06%
jan 1, 1981
11.233
+1.6
16.61%
jan 1, 1982
12.265
+1.032
9.18%
jan 1, 1983
14.684
+2.419
19.73%
jan 1, 1984
16.375
+1.69
11.51%
jan 1, 1985
17.204
+0.829
5.06%
jan 1, 1986
19.229
+2.025
11.77%
jan 1, 1987
18.795
-0.434
-2.26%
jan 1, 1988
17.173
-1.623
-8.63%
jan 1, 1989
17.477
+0.305
1.77%
jan 1, 1990
17.276
-0.201
-1.15%
jan 1, 1991
18.085
+0.809
4.69%
jan 1, 1992
18.88
+0.795
4.39%
jan 1, 1993
18.739
-0.14
-0.74%
jan 1, 1994
17.047
-1.693
-9.03%
jan 1, 1995
16.109
-0.938
-5.5%
jan 1, 1996
16.321
+0.212
1.32%
jan 1, 1997
16.491
+0.17
1.04%
jan 1, 1998
15.278
-1.213
-7.36%
jan 1, 1999
14.09
-1.188
-7.78%
jan 1, 2000
12.652
-1.437
-10.2%
jan 1, 2001
11.206
-1.447
-11.43%
jan 1, 2002
16.039
+4.833
43.13%
jan 1, 2003
15.919
-0.12
-0.75%
jan 1, 2004
15.216
-0.703
-4.41%
jan 1, 2005
14.87
-0.346
-2.28%
jan 1, 2006
14.732
-0.137
-0.92%
jan 1, 2007
14.463
-0.27
-1.83%
jan 1, 2008
15.112
+0.65
4.49%
jan 1, 2009
14.826
-0.286
-1.89%
jan 1, 2010
15.587
+0.76
5.13%
jan 1, 2011
15.412
-0.174
-1.12%
jan 1, 2012
16.391
+0.978
6.35%
jan 1, 2013
15.534
-0.857
-5.23%
jan 1, 2014
13.138
-2.396
-15.42%
jan 1, 2015
13.278
+0.14
1.06%
jan 1, 2016
12.58
-0.698
-5.26%
Ranking of countries by current statistics by years


Comments: