29
/
en
AIzaSyAYiBZKx7MnpbEhh9jyipgxe19OcubqV5w
April 1, 2024
86109
Bhutan
BTN
true
2
1
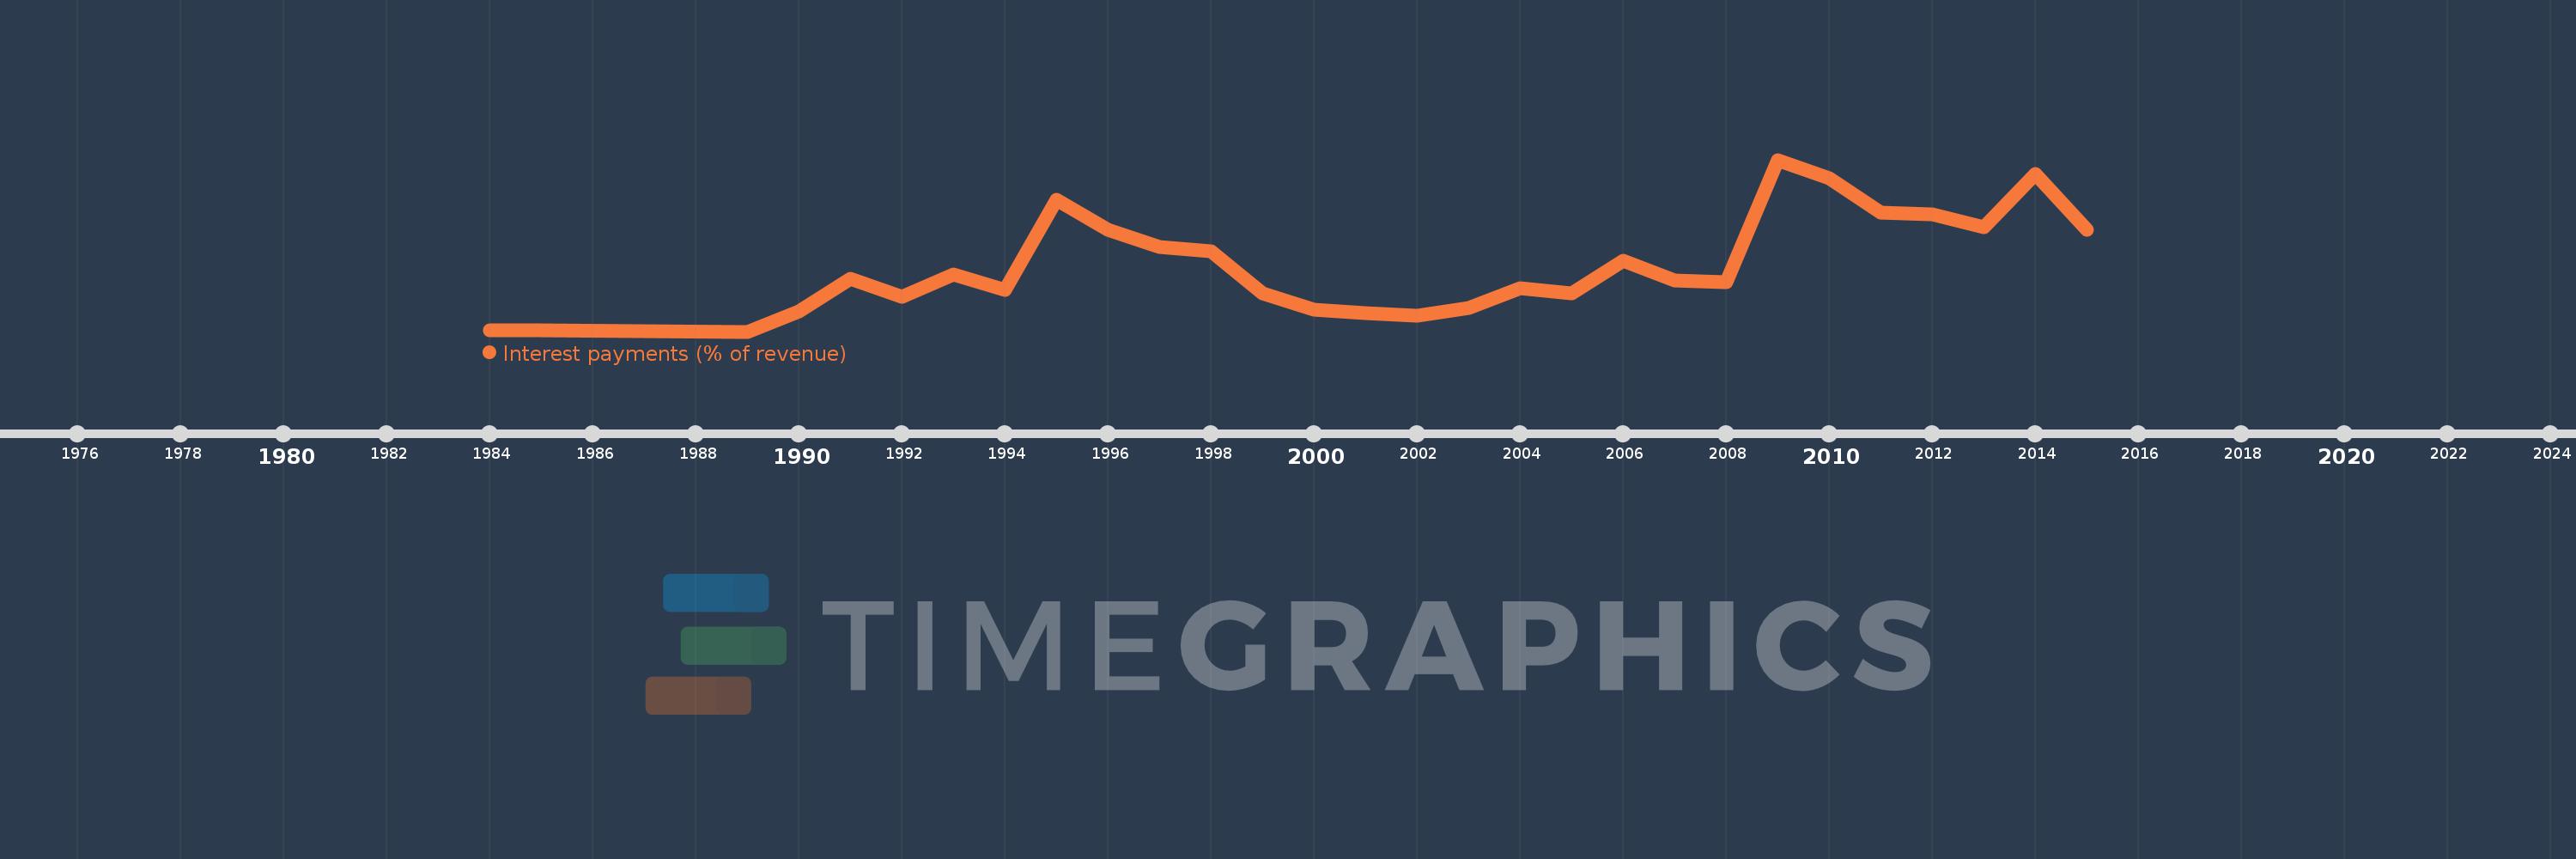
Interest payments (% of revenue)
2015,2014,2013,2012,2011,2010,2009,2008,2007,2006,2005,2004,2003,2002,2001,2000,1999,1998,1997,1996,1995,1994,1993,1992,1991,1990,1989,1985,1984
This statistics in other country:
AfghanistanAlbaniaAlgeriaAngolaAntigua and BarbudaArab WorldArmeniaAustraliaAustriaAzerbaijanBahamas, TheBahrainBangladeshBarbadosBelarusBelgiumBelizeBeninBhutanBoliviaBosnia and HerzegovinaBotswanaBrazilBulgariaBurkina FasoBurundiCabo VerdeCambodiaCanadaCaribbean small statesCentral African RepublicCentral Europe and the BalticsChileChinaColombiaCongo, Dem. Rep.Congo, Rep.Costa RicaCote d'IvoireCroatiaCyprusCzech RepublicDenmarkDominicaDominican RepublicEarly-demographic dividendEast Asia & PacificEast Asia & Pacific (excluding high income)East Asia & Pacific (IDA & IBRD countries)Egypt, Arab Rep.El SalvadorEquatorial GuineaEstoniaEthiopiaEuro areaEurope & Central AsiaEurope & Central Asia (excluding high income)Europe & Central Asia (IDA & IBRD countries)European UnionFijiFinlandFranceGambia, TheGeorgiaGermanyGhanaGreeceGrenadaGuatemalaHeavily indebted poor countries (HIPC)High incomeHondurasHong Kong SAR, ChinaHungaryIBRD onlyIcelandIDA & IBRD totalIDA blendIDA onlyIDA totalIndiaIndonesiaIran, Islamic Rep.IraqIrelandIsraelItalyJamaicaJapanJordanKazakhstanKenyaKiribatiKorea, Rep.KuwaitKyrgyz RepublicLao PDRLate-demographic dividendLatin America & Caribbean Latin America & Caribbean (excluding high income)Latin America & the Caribbean (IDA & IBRD countries)LatviaLeast developed countries: UN classificationLebanonLesothoLiberiaLithuaniaLow & middle incomeLow incomeLower middle incomeLuxembourgMacao SAR, ChinaMacedonia, FYRMadagascarMalawiMalaysiaMaldivesMaliMaltaMauritiusMexicoMicronesia, Fed. Sts.Middle East & North AfricaMiddle East & North Africa (excluding high income)Middle East & North Africa (IDA & IBRD countries)Middle incomeMoldovaMongoliaMoroccoMozambiqueNamibiaNepalNetherlandsNew ZealandNicaraguaNigeriaNorth AmericaNorwayOECD membersOmanOther small statesPakistanPanamaPapua New GuineaParaguayPeruPhilippinesPolandPortugalPost-demographic dividendPre-demographic dividendQatarRomaniaRussian FederationRwandaSamoaSan MarinoSao Tome and PrincipeSenegalSerbiaSeychellesSierra LeoneSingaporeSlovak RepublicSloveniaSmall statesSolomon IslandsSouth AfricaSouth AsiaSouth Asia (IDA & IBRD)SpainSri LankaSt. Kitts and NevisSt. LuciaSub-Saharan Africa Sub-Saharan Africa (excluding high income)Sub-Saharan Africa (IDA & IBRD countries)SurinameSwazilandSwedenSwitzerlandSyrian Arab RepublicTajikistanTanzaniaThailandTimor-LesteTogoTrinidad and TobagoTunisiaTurkeyUgandaUkraineUnited KingdomUnited StatesUpper middle incomeUruguayVanuatuVenezuela, RBVietnamWest Bank and GazaWorldYemen, Rep.ZambiaZimbabwe Timeline:
This timeline shows a graph from 1984 to 2015 of Bhutan. No data until 1983. Number of actual observations by date: 29.
Source name:
World Development Indicators
Source organization:
International Monetary Fund, Government Finance Statistics Yearbook and data files.
Categories, topics:
Public Sector
Last updated:
apr 23, 2017
Indicators value changes by year
At the date of observation
Value
Absolute change
Change from previous value
jan 1, 1984
0.089
+0.089
0.0%
jan 1, 1985
0.127
+0.038
42.72%
jan 1, 1989
0.04
-0.087
-68.75%
jan 1, 1990
1.143
+1.104
2.78K%
jan 1, 1991
2.917
+1.774
155.12%
jan 1, 1992
1.932
-0.985
-33.78%
jan 1, 1993
3.14
+1.209
62.57%
jan 1, 1994
2.328
-0.812
-25.87%
jan 1, 1995
7.215
+4.887
209.93%
jan 1, 1996
5.589
-1.626
-22.54%
jan 1, 1997
4.66
-0.929
-16.62%
jan 1, 1998
4.397
-0.263
-5.64%
jan 1, 1999
2.111
-2.286
-52.0%
jan 1, 2000
1.234
-0.877
-41.55%
jan 1, 2001
1.03
-0.204
-16.53%
jan 1, 2002
0.904
-0.126
-12.26%
jan 1, 2003
1.317
+0.413
45.71%
jan 1, 2004
2.407
+1.091
82.85%
jan 1, 2005
2.124
-0.284
-11.78%
jan 1, 2006
3.884
+1.76
82.88%
jan 1, 2007
2.84
-1.044
-26.87%
jan 1, 2008
2.756
-0.084
-2.95%
jan 1, 2009
9.406
+6.65
241.26%
jan 1, 2010
8.407
-0.999
-10.62%
jan 1, 2011
6.531
-1.876
-22.31%
jan 1, 2012
6.435
-0.096
-1.47%
jan 1, 2013
5.751
-0.684
-10.63%
jan 1, 2014
8.632
+2.881
50.1%
jan 1, 2015
5.586
-3.046
-35.29%
Ranking of countries by current statistics by years


Comments: