29
/
en
AIzaSyAYiBZKx7MnpbEhh9jyipgxe19OcubqV5w
April 1, 2024
153691
Iceland
ISL
true
2
1
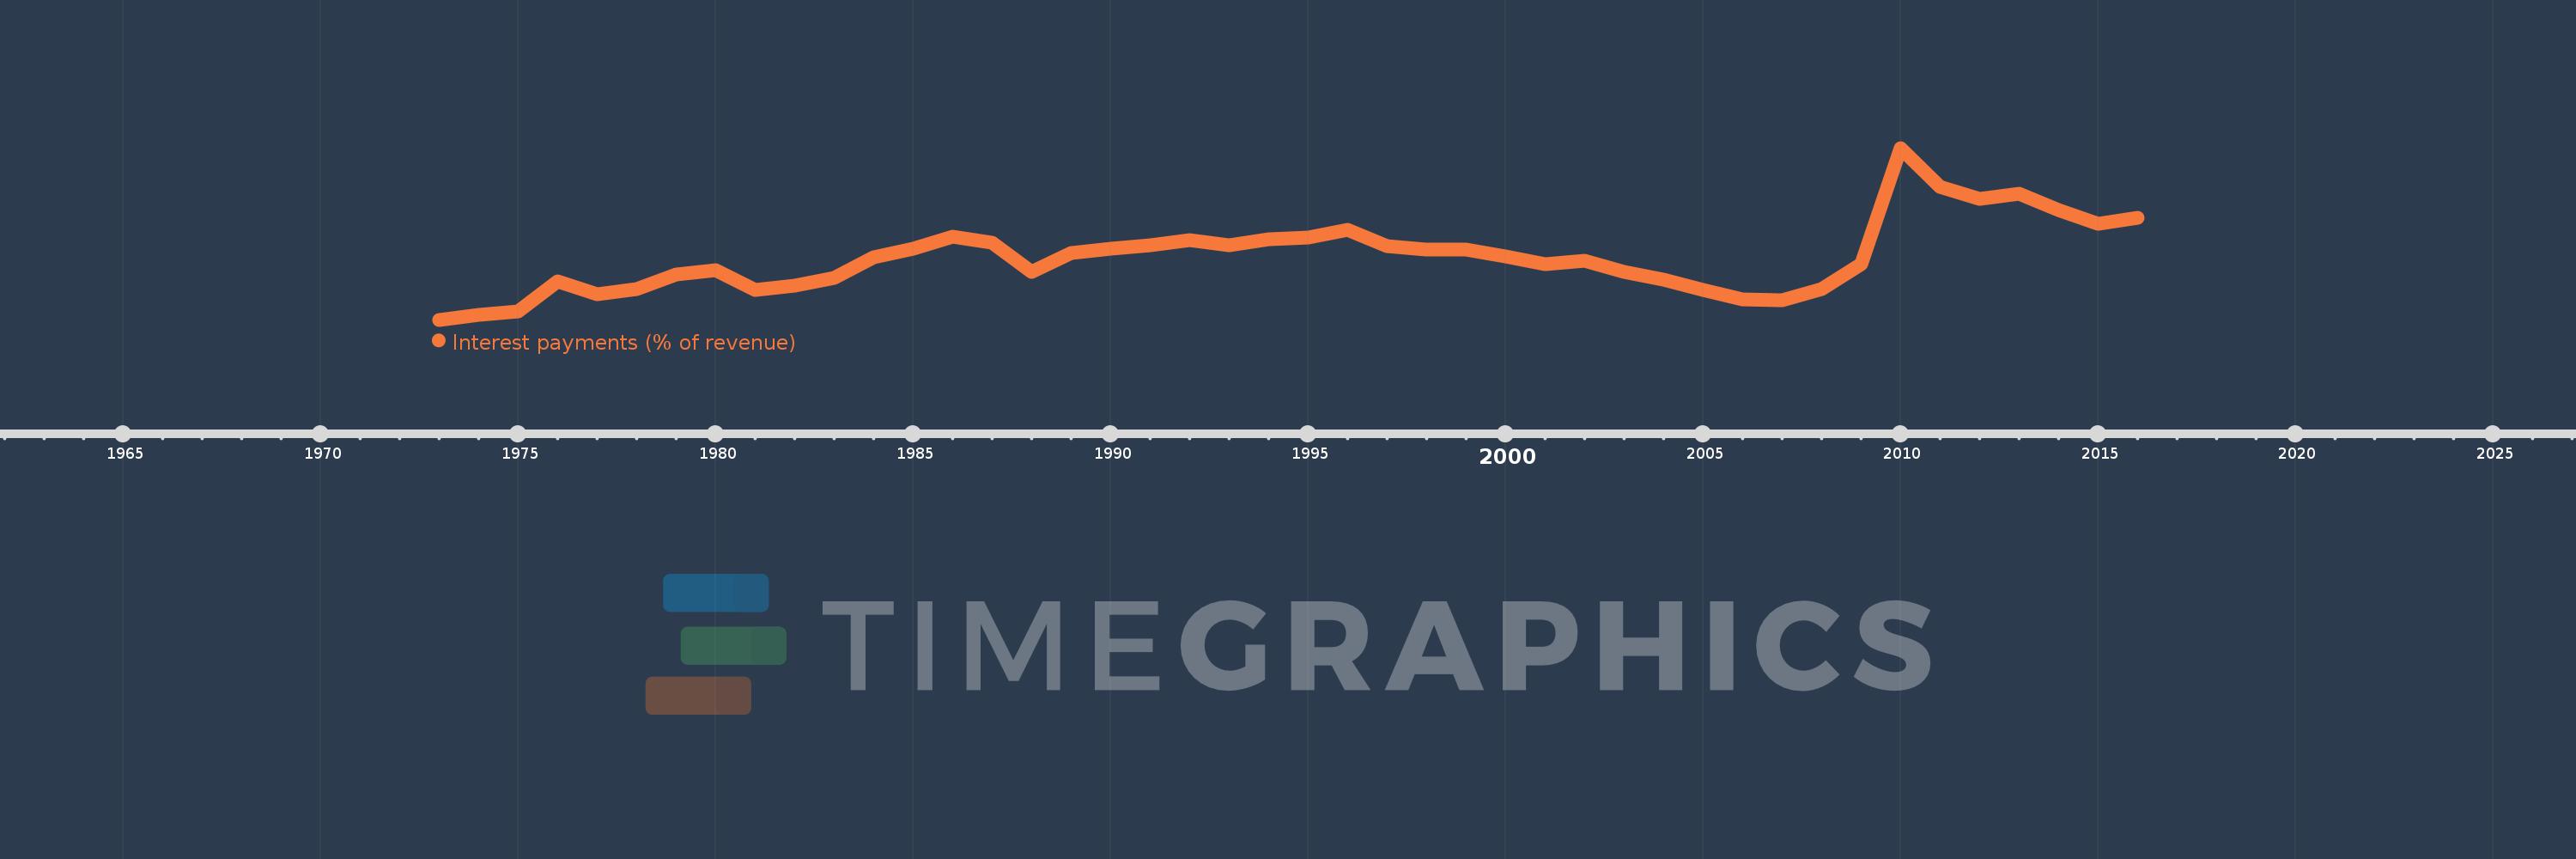
Interest payments (% of revenue)
2016,2015,2014,2013,2012,2011,2010,2009,2008,2007,2006,2005,2004,2003,2002,2001,2000,1999,1998,1997,1996,1995,1994,1993,1992,1991,1990,1989,1988,1987,1986,1985,1984,1983,1982,1981,1980,1979,1978,1977,1976,1975,1974,1973
This statistics in other country:
AfghanistanAlbaniaAlgeriaAngolaAntigua and BarbudaArab WorldArmeniaAustraliaAustriaAzerbaijanBahamas, TheBahrainBangladeshBarbadosBelarusBelgiumBelizeBeninBhutanBoliviaBosnia and HerzegovinaBotswanaBrazilBulgariaBurkina FasoBurundiCabo VerdeCambodiaCanadaCaribbean small statesCentral African RepublicCentral Europe and the BalticsChileChinaColombiaCongo, Dem. Rep.Congo, Rep.Costa RicaCote d'IvoireCroatiaCyprusCzech RepublicDenmarkDominicaDominican RepublicEarly-demographic dividendEast Asia & PacificEast Asia & Pacific (excluding high income)East Asia & Pacific (IDA & IBRD countries)Egypt, Arab Rep.El SalvadorEquatorial GuineaEstoniaEthiopiaEuro areaEurope & Central AsiaEurope & Central Asia (excluding high income)Europe & Central Asia (IDA & IBRD countries)European UnionFijiFinlandFranceGambia, TheGeorgiaGermanyGhanaGreeceGrenadaGuatemalaHeavily indebted poor countries (HIPC)High incomeHondurasHong Kong SAR, ChinaHungaryIBRD onlyIcelandIDA & IBRD totalIDA blendIDA onlyIDA totalIndiaIndonesiaIran, Islamic Rep.IraqIrelandIsraelItalyJamaicaJapanJordanKazakhstanKenyaKiribatiKorea, Rep.KuwaitKyrgyz RepublicLao PDRLate-demographic dividendLatin America & Caribbean Latin America & Caribbean (excluding high income)Latin America & the Caribbean (IDA & IBRD countries)LatviaLeast developed countries: UN classificationLebanonLesothoLiberiaLithuaniaLow & middle incomeLow incomeLower middle incomeLuxembourgMacao SAR, ChinaMacedonia, FYRMadagascarMalawiMalaysiaMaldivesMaliMaltaMauritiusMexicoMicronesia, Fed. Sts.Middle East & North AfricaMiddle East & North Africa (excluding high income)Middle East & North Africa (IDA & IBRD countries)Middle incomeMoldovaMongoliaMoroccoMozambiqueNamibiaNepalNetherlandsNew ZealandNicaraguaNigeriaNorth AmericaNorwayOECD membersOmanOther small statesPakistanPanamaPapua New GuineaParaguayPeruPhilippinesPolandPortugalPost-demographic dividendPre-demographic dividendQatarRomaniaRussian FederationRwandaSamoaSan MarinoSao Tome and PrincipeSenegalSerbiaSeychellesSierra LeoneSingaporeSlovak RepublicSloveniaSmall statesSolomon IslandsSouth AfricaSouth AsiaSouth Asia (IDA & IBRD)SpainSri LankaSt. Kitts and NevisSt. LuciaSub-Saharan Africa Sub-Saharan Africa (excluding high income)Sub-Saharan Africa (IDA & IBRD countries)SurinameSwazilandSwedenSwitzerlandSyrian Arab RepublicTajikistanTanzaniaThailandTimor-LesteTogoTrinidad and TobagoTunisiaTurkeyUgandaUkraineUnited KingdomUnited StatesUpper middle incomeUruguayVanuatuVenezuela, RBVietnamWest Bank and GazaWorldYemen, Rep.ZambiaZimbabwe Timeline:
This timeline shows a graph from 1973 to 2016 of Iceland. No data until 1972. Number of actual observations by date: 44.
Source name:
World Development Indicators
Source organization:
International Monetary Fund, Government Finance Statistics Yearbook and data files.
Categories, topics:
Public Sector
Last updated:
apr 23, 2017
Indicators value changes by year
Maximum:
20.653
jan 1, 2010
At the date of observation
Value
Absolute change
Change from previous value
jan 1, 1973
2.894
+2.894
0.0%
jan 1, 1974
3.433
+0.539
18.61%
jan 1, 1975
3.755
+0.323
9.41%
jan 1, 1976
6.821
+3.066
81.63%
jan 1, 1977
5.561
-1.26
-18.48%
jan 1, 1978
6.088
+0.528
9.49%
jan 1, 1979
7.585
+1.496
24.58%
jan 1, 1980
7.981
+0.396
5.23%
jan 1, 1981
5.936
-2.045
-25.63%
jan 1, 1982
6.399
+0.463
7.8%
jan 1, 1983
7.238
+0.84
13.12%
jan 1, 1984
9.365
+2.127
29.38%
jan 1, 1985
10.264
+0.899
9.6%
jan 1, 1986
11.52
+1.256
12.23%
jan 1, 1987
10.839
-0.681
-5.91%
jan 1, 1988
7.879
-2.96
-27.31%
jan 1, 1989
9.797
+1.918
24.35%
jan 1, 1990
10.22
+0.423
4.32%
jan 1, 1991
10.6
+0.38
3.72%
jan 1, 1992
11.118
+0.517
4.88%
jan 1, 1993
10.573
-0.545
-4.9%
jan 1, 1994
11.2
+0.627
5.93%
jan 1, 1995
11.432
+0.233
2.08%
jan 1, 1996
12.214
+0.781
6.83%
jan 1, 1997
10.543
-1.671
-13.68%
jan 1, 1998
10.136
-0.406
-3.86%
jan 1, 1999
10.157
+0.021
0.2%
jan 1, 2000
9.418
-0.739
-7.28%
jan 1, 2001
8.632
-0.786
-8.35%
jan 1, 2002
8.977
+0.345
4.0%
jan 1, 2003
7.877
-1.1
-12.26%
jan 1, 2004
7.023
-0.854
-10.84%
jan 1, 2005
6.017
-1.006
-14.33%
jan 1, 2006
5.035
-0.982
-16.32%
jan 1, 2007
4.89
-0.145
-2.88%
jan 1, 2008
6.104
+1.214
24.83%
jan 1, 2009
8.611
+2.507
41.06%
jan 1, 2010
20.653
+12.042
139.85%
jan 1, 2011
16.607
-4.046
-19.59%
jan 1, 2012
15.347
-1.26
-7.59%
jan 1, 2013
15.964
+0.617
4.02%
jan 1, 2014
14.241
-1.723
-10.79%
jan 1, 2015
12.798
-1.444
-10.14%
jan 1, 2016
13.477
+0.679
5.31%
Ranking of countries by current statistics by years


Comments: