29
/
en
AIzaSyAYiBZKx7MnpbEhh9jyipgxe19OcubqV5w
April 1, 2024
91317
Brazil
BRA
true
2
1
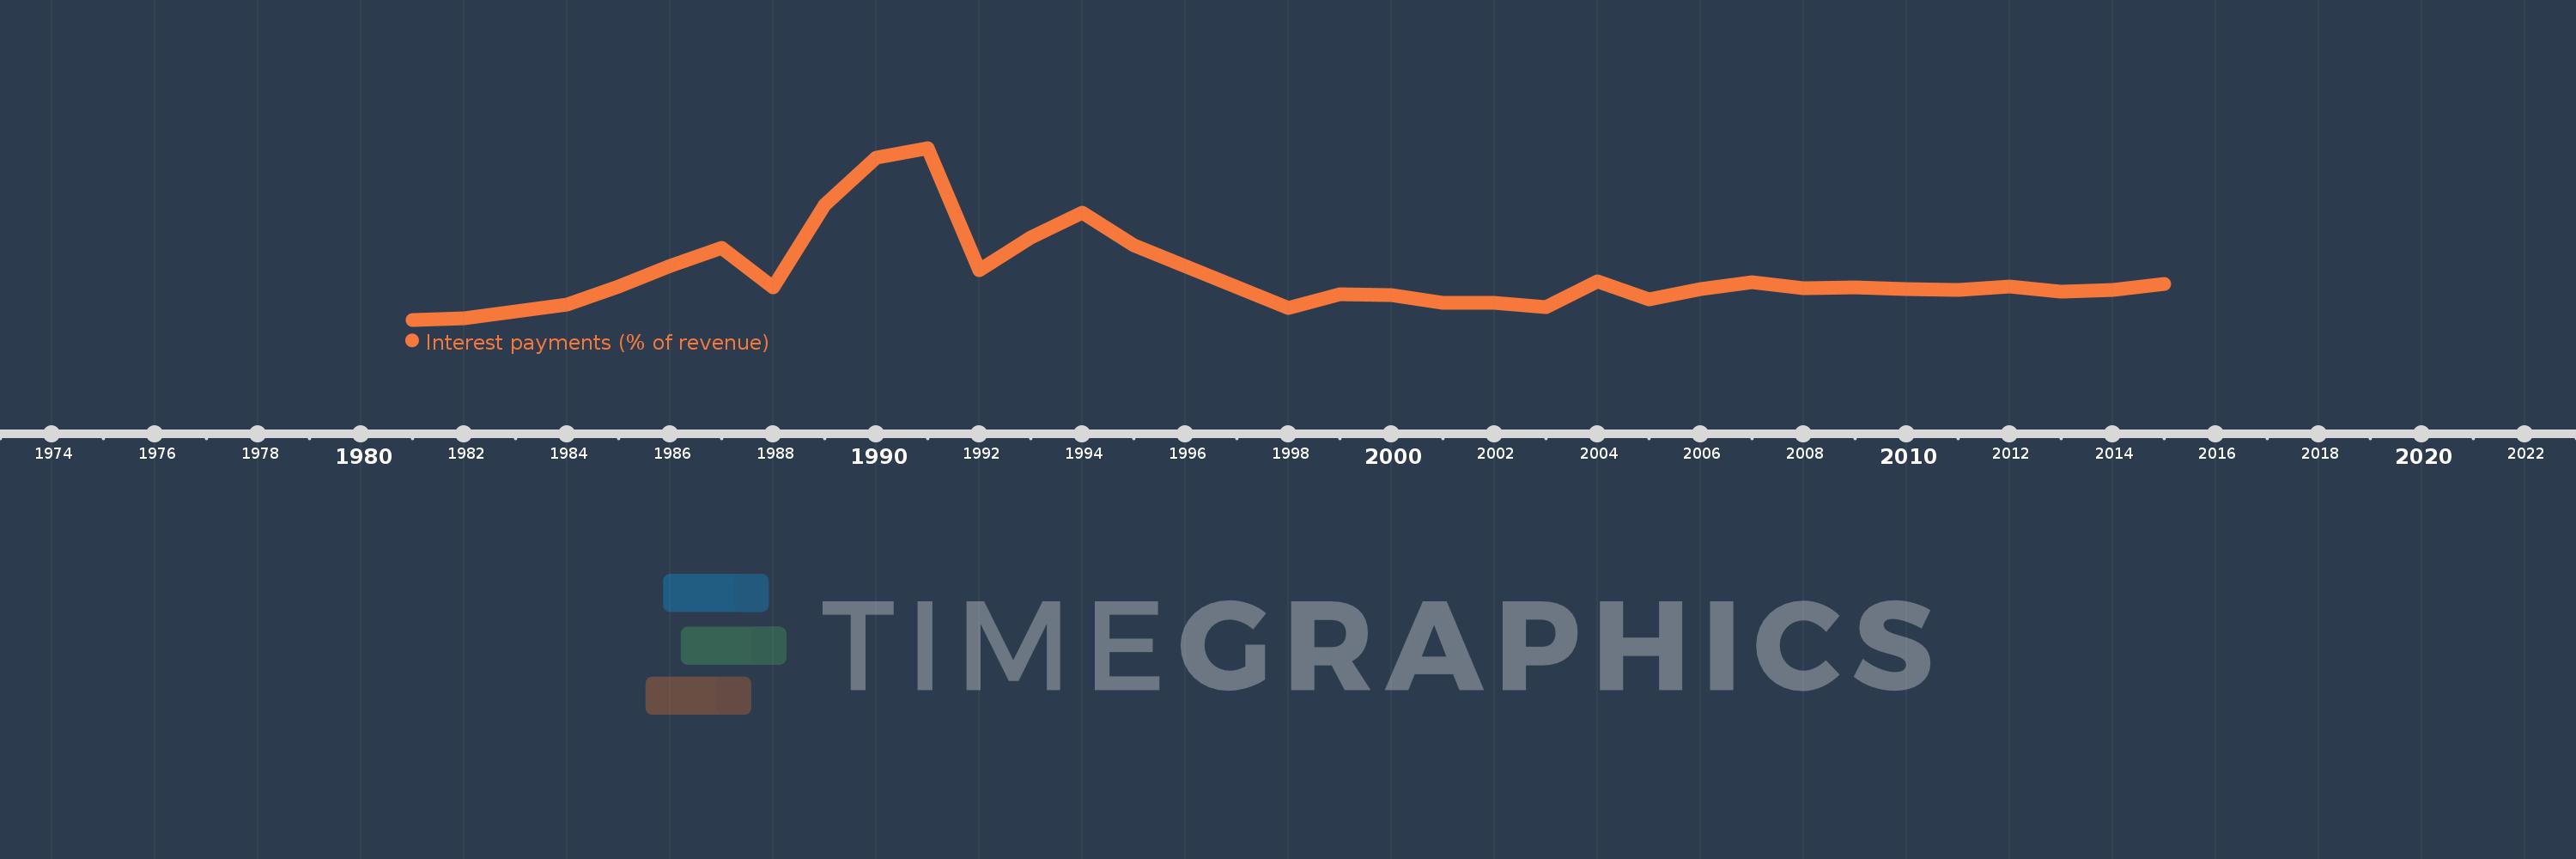
Interest payments (% of revenue)
2015,2014,2013,2012,2011,2010,2009,2008,2007,2006,2005,2004,2003,2002,2001,2000,1999,1998,1995,1994,1993,1992,1991,1990,1989,1988,1987,1986,1985,1984,1983,1982,1981
This statistics in other country:
AfghanistanAlbaniaAlgeriaAngolaAntigua and BarbudaArab WorldArmeniaAustraliaAustriaAzerbaijanBahamas, TheBahrainBangladeshBarbadosBelarusBelgiumBelizeBeninBhutanBoliviaBosnia and HerzegovinaBotswanaBrazilBulgariaBurkina FasoBurundiCabo VerdeCambodiaCanadaCaribbean small statesCentral African RepublicCentral Europe and the BalticsChileChinaColombiaCongo, Dem. Rep.Congo, Rep.Costa RicaCote d'IvoireCroatiaCyprusCzech RepublicDenmarkDominicaDominican RepublicEarly-demographic dividendEast Asia & PacificEast Asia & Pacific (excluding high income)East Asia & Pacific (IDA & IBRD countries)Egypt, Arab Rep.El SalvadorEquatorial GuineaEstoniaEthiopiaEuro areaEurope & Central AsiaEurope & Central Asia (excluding high income)Europe & Central Asia (IDA & IBRD countries)European UnionFijiFinlandFranceGambia, TheGeorgiaGermanyGhanaGreeceGrenadaGuatemalaHeavily indebted poor countries (HIPC)High incomeHondurasHong Kong SAR, ChinaHungaryIBRD onlyIcelandIDA & IBRD totalIDA blendIDA onlyIDA totalIndiaIndonesiaIran, Islamic Rep.IraqIrelandIsraelItalyJamaicaJapanJordanKazakhstanKenyaKiribatiKorea, Rep.KuwaitKyrgyz RepublicLao PDRLate-demographic dividendLatin America & Caribbean Latin America & Caribbean (excluding high income)Latin America & the Caribbean (IDA & IBRD countries)LatviaLeast developed countries: UN classificationLebanonLesothoLiberiaLithuaniaLow & middle incomeLow incomeLower middle incomeLuxembourgMacao SAR, ChinaMacedonia, FYRMadagascarMalawiMalaysiaMaldivesMaliMaltaMauritiusMexicoMicronesia, Fed. Sts.Middle East & North AfricaMiddle East & North Africa (excluding high income)Middle East & North Africa (IDA & IBRD countries)Middle incomeMoldovaMongoliaMoroccoMozambiqueNamibiaNepalNetherlandsNew ZealandNicaraguaNigeriaNorth AmericaNorwayOECD membersOmanOther small statesPakistanPanamaPapua New GuineaParaguayPeruPhilippinesPolandPortugalPost-demographic dividendPre-demographic dividendQatarRomaniaRussian FederationRwandaSamoaSan MarinoSao Tome and PrincipeSenegalSerbiaSeychellesSierra LeoneSingaporeSlovak RepublicSloveniaSmall statesSolomon IslandsSouth AfricaSouth AsiaSouth Asia (IDA & IBRD)SpainSri LankaSt. Kitts and NevisSt. LuciaSub-Saharan Africa Sub-Saharan Africa (excluding high income)Sub-Saharan Africa (IDA & IBRD countries)SurinameSwazilandSwedenSwitzerlandSyrian Arab RepublicTajikistanTanzaniaThailandTimor-LesteTogoTrinidad and TobagoTunisiaTurkeyUgandaUkraineUnited KingdomUnited StatesUpper middle incomeUruguayVanuatuVenezuela, RBVietnamWest Bank and GazaWorldYemen, Rep.ZambiaZimbabwe Timeline:
This timeline shows a graph from 1981 to 2015 of Brazil. No data until 1980. Number of actual observations by date: 33.
Source name:
World Development Indicators
Source organization:
International Monetary Fund, Government Finance Statistics Yearbook and data files.
Categories, topics:
Public Sector
Last updated:
apr 23, 2017
Indicators value changes by year
Maximum:
118.442
jan 1, 1991
At the date of observation
Value
Absolute change
Change from previous value
jan 1, 1981
7.143
+7.143
0.0%
jan 1, 1982
8.333
+1.19
16.67%
jan 1, 1983
12.698
+4.365
52.38%
jan 1, 1984
16.944
+4.245
33.43%
jan 1, 1985
28.619
+11.675
68.91%
jan 1, 1986
42.204
+13.585
47.47%
jan 1, 1987
53.5
+11.296
26.77%
jan 1, 1988
28.069
-25.43
-47.53%
jan 1, 1989
81.452
+53.382
190.18%
jan 1, 1990
111.959
+30.507
37.45%
jan 1, 1991
118.442
+6.483
5.79%
jan 1, 1992
39.332
-79.11
-66.79%
jan 1, 1993
60.61
+21.278
54.1%
jan 1, 1994
76.374
+15.764
26.01%
jan 1, 1995
55.155
-21.219
-27.78%
jan 1, 1998
14.548
-40.608
-73.62%
jan 1, 1999
23.802
+9.254
63.61%
jan 1, 2000
22.867
-0.934
-3.93%
jan 1, 2001
18.378
-4.489
-19.63%
jan 1, 2002
18.346
-0.032
-0.18%
jan 1, 2003
15.524
-2.822
-15.38%
jan 1, 2004
31.786
+16.262
104.75%
jan 1, 2005
20.489
-11.297
-35.54%
jan 1, 2006
26.741
+6.251
30.51%
jan 1, 2007
31.458
+4.718
17.64%
jan 1, 2008
27.376
-4.082
-12.98%
jan 1, 2009
27.899
+0.523
1.91%
jan 1, 2010
26.878
-1.021
-3.66%
jan 1, 2011
26.442
-0.437
-1.62%
jan 1, 2012
28.447
+2.006
7.58%
jan 1, 2013
25.565
-2.882
-10.13%
jan 1, 2014
26.458
+0.892
3.49%
jan 1, 2015
30.136
+3.678
13.9%
Ranking of countries by current statistics by years


Comments: