29
/
en
AIzaSyAYiBZKx7MnpbEhh9jyipgxe19OcubqV5w
April 1, 2024
191545
Malta
MLT
true
2
1
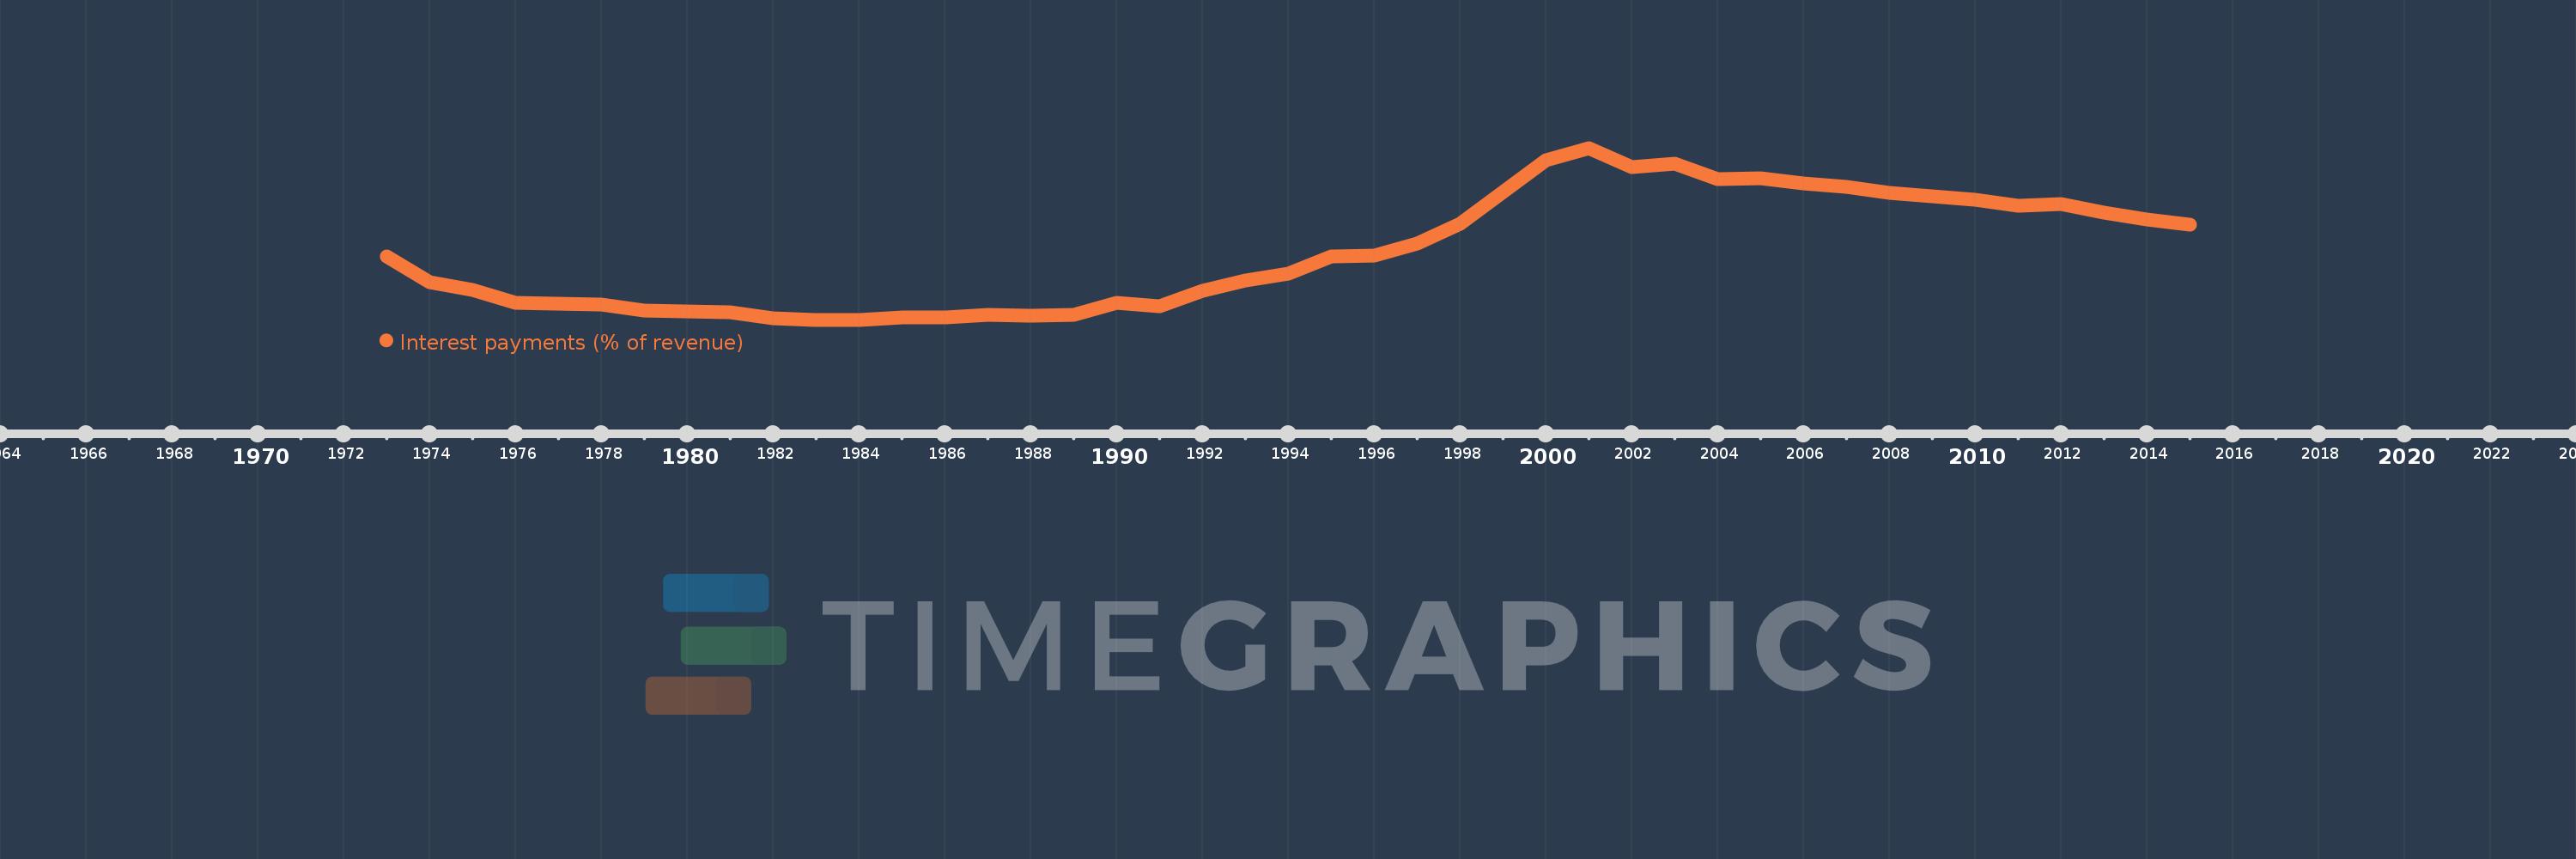
Interest payments (% of revenue)
2015,2014,2013,2012,2011,2010,2009,2008,2007,2006,2005,2004,2003,2002,2001,2000,1999,1998,1997,1996,1995,1994,1993,1992,1991,1990,1989,1988,1987,1986,1985,1984,1983,1982,1981,1979,1978,1977,1976,1975,1974,1973
This statistics in other country:
AfghanistanAlbaniaAlgeriaAngolaAntigua and BarbudaArab WorldArmeniaAustraliaAustriaAzerbaijanBahamas, TheBahrainBangladeshBarbadosBelarusBelgiumBelizeBeninBhutanBoliviaBosnia and HerzegovinaBotswanaBrazilBulgariaBurkina FasoBurundiCabo VerdeCambodiaCanadaCaribbean small statesCentral African RepublicCentral Europe and the BalticsChileChinaColombiaCongo, Dem. Rep.Congo, Rep.Costa RicaCote d'IvoireCroatiaCyprusCzech RepublicDenmarkDominicaDominican RepublicEarly-demographic dividendEast Asia & PacificEast Asia & Pacific (excluding high income)East Asia & Pacific (IDA & IBRD countries)Egypt, Arab Rep.El SalvadorEquatorial GuineaEstoniaEthiopiaEuro areaEurope & Central AsiaEurope & Central Asia (excluding high income)Europe & Central Asia (IDA & IBRD countries)European UnionFijiFinlandFranceGambia, TheGeorgiaGermanyGhanaGreeceGrenadaGuatemalaHeavily indebted poor countries (HIPC)High incomeHondurasHong Kong SAR, ChinaHungaryIBRD onlyIcelandIDA & IBRD totalIDA blendIDA onlyIDA totalIndiaIndonesiaIran, Islamic Rep.IraqIrelandIsraelItalyJamaicaJapanJordanKazakhstanKenyaKiribatiKorea, Rep.KuwaitKyrgyz RepublicLao PDRLate-demographic dividendLatin America & Caribbean Latin America & Caribbean (excluding high income)Latin America & the Caribbean (IDA & IBRD countries)LatviaLeast developed countries: UN classificationLebanonLesothoLiberiaLithuaniaLow & middle incomeLow incomeLower middle incomeLuxembourgMacao SAR, ChinaMacedonia, FYRMadagascarMalawiMalaysiaMaldivesMaliMaltaMauritiusMexicoMicronesia, Fed. Sts.Middle East & North AfricaMiddle East & North Africa (excluding high income)Middle East & North Africa (IDA & IBRD countries)Middle incomeMoldovaMongoliaMoroccoMozambiqueNamibiaNepalNetherlandsNew ZealandNicaraguaNigeriaNorth AmericaNorwayOECD membersOmanOther small statesPakistanPanamaPapua New GuineaParaguayPeruPhilippinesPolandPortugalPost-demographic dividendPre-demographic dividendQatarRomaniaRussian FederationRwandaSamoaSan MarinoSao Tome and PrincipeSenegalSerbiaSeychellesSierra LeoneSingaporeSlovak RepublicSloveniaSmall statesSolomon IslandsSouth AfricaSouth AsiaSouth Asia (IDA & IBRD)SpainSri LankaSt. Kitts and NevisSt. LuciaSub-Saharan Africa Sub-Saharan Africa (excluding high income)Sub-Saharan Africa (IDA & IBRD countries)SurinameSwazilandSwedenSwitzerlandSyrian Arab RepublicTajikistanTanzaniaThailandTimor-LesteTogoTrinidad and TobagoTunisiaTurkeyUgandaUkraineUnited KingdomUnited StatesUpper middle incomeUruguayVanuatuVenezuela, RBVietnamWest Bank and GazaWorldYemen, Rep.ZambiaZimbabwe Timeline:
This timeline shows a graph from 1973 to 2015 of Malta. No data until 1972. Number of actual observations by date: 42.
Source name:
World Development Indicators
Source organization:
International Monetary Fund, Government Finance Statistics Yearbook and data files.
Categories, topics:
Public Sector
Last updated:
apr 23, 2017
Indicators value changes by year
Maximum:
11.744
jan 1, 2001
At the date of observation
Value
Absolute change
Change from previous value
jan 1, 1973
4.975
+4.975
0.0%
jan 1, 1974
3.403
-1.572
-31.6%
jan 1, 1975
2.938
-0.466
-13.68%
jan 1, 1976
2.125
-0.813
-27.66%
jan 1, 1977
2.068
-0.057
-2.7%
jan 1, 1978
2.002
-0.066
-3.18%
jan 1, 1979
1.658
-0.344
-17.19%
jan 1, 1981
1.505
-0.153
-9.24%
jan 1, 1982
1.167
-0.338
-22.45%
jan 1, 1983
1.06
-0.107
-9.19%
jan 1, 1984
1.064
+0.004
0.37%
jan 1, 1985
1.182
+0.119
11.15%
jan 1, 1986
1.224
+0.042
3.51%
jan 1, 1987
1.354
+0.13
10.66%
jan 1, 1988
1.309
-0.045
-3.36%
jan 1, 1989
1.38
+0.072
5.47%
jan 1, 1990
2.118
+0.738
53.48%
jan 1, 1991
1.914
-0.204
-9.64%
jan 1, 1992
2.876
+0.962
50.25%
jan 1, 1993
3.479
+0.602
20.95%
jan 1, 1994
3.93
+0.452
12.99%
jan 1, 1995
4.995
+1.065
27.09%
jan 1, 1996
5.072
+0.076
1.53%
jan 1, 1997
5.781
+0.709
13.99%
jan 1, 1998
7.035
+1.254
21.7%
jan 1, 1999
8.983
+1.948
27.69%
jan 1, 2000
10.983
+2.0
22.26%
jan 1, 2001
11.744
+0.76
6.92%
jan 1, 2002
10.535
-1.209
-10.29%
jan 1, 2003
10.773
+0.239
2.26%
jan 1, 2004
9.827
-0.947
-8.79%
jan 1, 2005
9.843
+0.016
0.17%
jan 1, 2006
9.564
-0.279
-2.83%
jan 1, 2007
9.35
-0.215
-2.24%
jan 1, 2008
8.964
-0.385
-4.12%
jan 1, 2009
8.734
-0.23
-2.57%
jan 1, 2010
8.514
-0.22
-2.52%
jan 1, 2011
8.168
-0.345
-4.06%
jan 1, 2012
8.248
+0.079
0.97%
jan 1, 2013
7.718
-0.53
-6.42%
jan 1, 2014
7.315
-0.403
-5.22%
jan 1, 2015
6.977
-0.338
-4.62%
Ranking of countries by current statistics by years


Comments: