29
/
en
AIzaSyAYiBZKx7MnpbEhh9jyipgxe19OcubqV5w
April 1, 2024
201737
Morocco
MAR
true
2
1
Interest payments (% of revenue)
2012,2011,2010,2009,2008,2007,2006,2005,2004,2003,2000,1999,1998,1996,1995,1994,1993,1992,1991,1990,1989,1988,1987,1986,1985,1984,1983,1982,1981,1980,1979,1978,1977,1976,1975,1974,1973
This statistics in other country:
AfghanistanAlbaniaAlgeriaAngolaAntigua and BarbudaArab WorldArmeniaAustraliaAustriaAzerbaijanBahamas, TheBahrainBangladeshBarbadosBelarusBelgiumBelizeBeninBhutanBoliviaBosnia and HerzegovinaBotswanaBrazilBulgariaBurkina FasoBurundiCabo VerdeCambodiaCanadaCaribbean small statesCentral African RepublicCentral Europe and the BalticsChileChinaColombiaCongo, Dem. Rep.Congo, Rep.Costa RicaCote d'IvoireCroatiaCyprusCzech RepublicDenmarkDominicaDominican RepublicEarly-demographic dividendEast Asia & PacificEast Asia & Pacific (excluding high income)East Asia & Pacific (IDA & IBRD countries)Egypt, Arab Rep.El SalvadorEquatorial GuineaEstoniaEthiopiaEuro areaEurope & Central AsiaEurope & Central Asia (excluding high income)Europe & Central Asia (IDA & IBRD countries)European UnionFijiFinlandFranceGambia, TheGeorgiaGermanyGhanaGreeceGrenadaGuatemalaHeavily indebted poor countries (HIPC)High incomeHondurasHong Kong SAR, ChinaHungaryIBRD onlyIcelandIDA & IBRD totalIDA blendIDA onlyIDA totalIndiaIndonesiaIran, Islamic Rep.IraqIrelandIsraelItalyJamaicaJapanJordanKazakhstanKenyaKiribatiKorea, Rep.KuwaitKyrgyz RepublicLao PDRLate-demographic dividendLatin America & Caribbean Latin America & Caribbean (excluding high income)Latin America & the Caribbean (IDA & IBRD countries)LatviaLeast developed countries: UN classificationLebanonLesothoLiberiaLithuaniaLow & middle incomeLow incomeLower middle incomeLuxembourgMacao SAR, ChinaMacedonia, FYRMadagascarMalawiMalaysiaMaldivesMaliMaltaMauritiusMexicoMicronesia, Fed. Sts.Middle East & North AfricaMiddle East & North Africa (excluding high income)Middle East & North Africa (IDA & IBRD countries)Middle incomeMoldovaMongoliaMoroccoMozambiqueNamibiaNepalNetherlandsNew ZealandNicaraguaNigeriaNorth AmericaNorwayOECD membersOmanOther small statesPakistanPanamaPapua New GuineaParaguayPeruPhilippinesPolandPortugalPost-demographic dividendPre-demographic dividendQatarRomaniaRussian FederationRwandaSamoaSan MarinoSao Tome and PrincipeSenegalSerbiaSeychellesSierra LeoneSingaporeSlovak RepublicSloveniaSmall statesSolomon IslandsSouth AfricaSouth AsiaSouth Asia (IDA & IBRD)SpainSri LankaSt. Kitts and NevisSt. LuciaSub-Saharan Africa Sub-Saharan Africa (excluding high income)Sub-Saharan Africa (IDA & IBRD countries)SurinameSwazilandSwedenSwitzerlandSyrian Arab RepublicTajikistanTanzaniaThailandTimor-LesteTogoTrinidad and TobagoTunisiaTurkeyUgandaUkraineUnited KingdomUnited StatesUpper middle incomeUruguayVanuatuVenezuela, RBVietnamWest Bank and GazaWorldYemen, Rep.ZambiaZimbabwe Timeline:
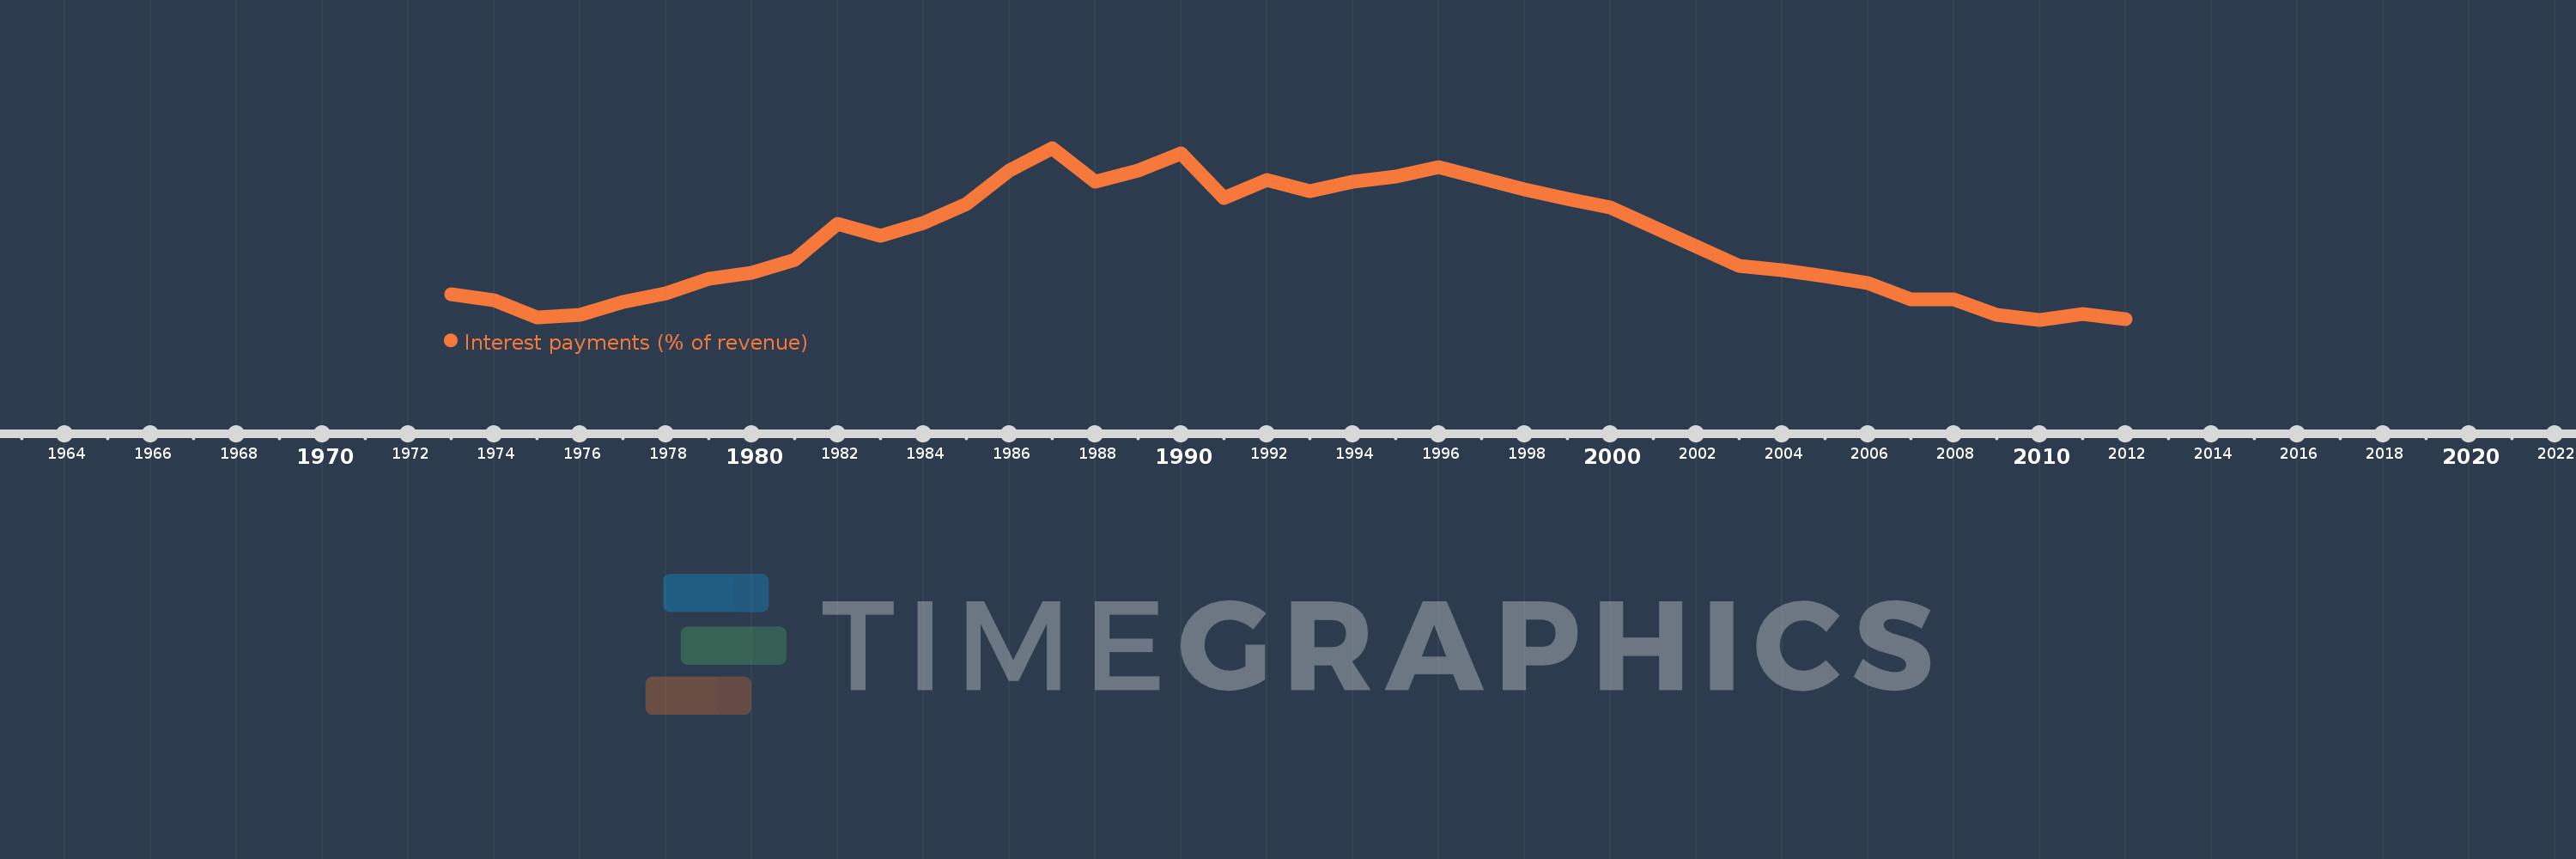
This timeline shows a graph from 1973 to 2012 of Morocco. No data until 1972. Number of actual observations by date: 37.
Source name:
World Development Indicators
Source organization:
International Monetary Fund, Government Finance Statistics Yearbook and data files.
Categories, topics:
Public Sector
Last updated:
apr 23, 2017
Indicators value changes by year
Maximum:
23.552
jan 1, 1987
At the date of observation
Value
Absolute change
Change from previous value
jan 1, 1973
6.12
+6.12
0.0%
jan 1, 1974
5.397
-0.723
-11.81%
jan 1, 1975
3.373
-2.024
-37.5%
jan 1, 1976
3.644
+0.271
8.02%
jan 1, 1977
5.231
+1.588
43.57%
jan 1, 1978
6.236
+1.005
19.21%
jan 1, 1979
7.942
+1.706
27.35%
jan 1, 1980
8.739
+0.797
10.04%
jan 1, 1981
10.2
+1.461
16.72%
jan 1, 1982
14.572
+4.372
42.86%
jan 1, 1983
13.056
-1.515
-10.4%
jan 1, 1984
14.653
+1.597
12.23%
jan 1, 1985
16.837
+2.183
14.9%
jan 1, 1986
20.852
+4.016
23.85%
jan 1, 1987
23.552
+2.7
12.95%
jan 1, 1988
19.504
-4.049
-17.19%
jan 1, 1989
20.858
+1.355
6.95%
jan 1, 1990
22.883
+2.025
9.71%
jan 1, 1991
17.621
-5.263
-23.0%
jan 1, 1992
19.716
+2.095
11.89%
jan 1, 1993
18.387
-1.329
-6.74%
jan 1, 1994
19.502
+1.114
6.06%
jan 1, 1995
20.192
+0.69
3.54%
jan 1, 1996
21.248
+1.057
5.23%
jan 1, 1998
18.565
-2.683
-12.63%
jan 1, 1999
17.478
-1.087
-5.86%
jan 1, 2000
16.502
-0.976
-5.58%
jan 1, 2003
9.558
-6.944
-42.08%
jan 1, 2004
8.969
-0.589
-6.16%
jan 1, 2005
8.296
-0.673
-7.5%
jan 1, 2006
7.493
-0.803
-9.68%
jan 1, 2007
5.499
-1.994
-26.61%
jan 1, 2008
5.569
+0.071
1.28%
jan 1, 2009
3.697
-1.872
-33.62%
jan 1, 2010
3.108
-0.589
-15.94%
jan 1, 2011
3.756
+0.648
20.86%
jan 1, 2012
3.136
-0.619
-16.49%
Ranking of countries by current statistics by years


Comments: