29
/
en
AIzaSyAYiBZKx7MnpbEhh9jyipgxe19OcubqV5w
April 1, 2024
117040
Cyprus
CYP
true
2
1
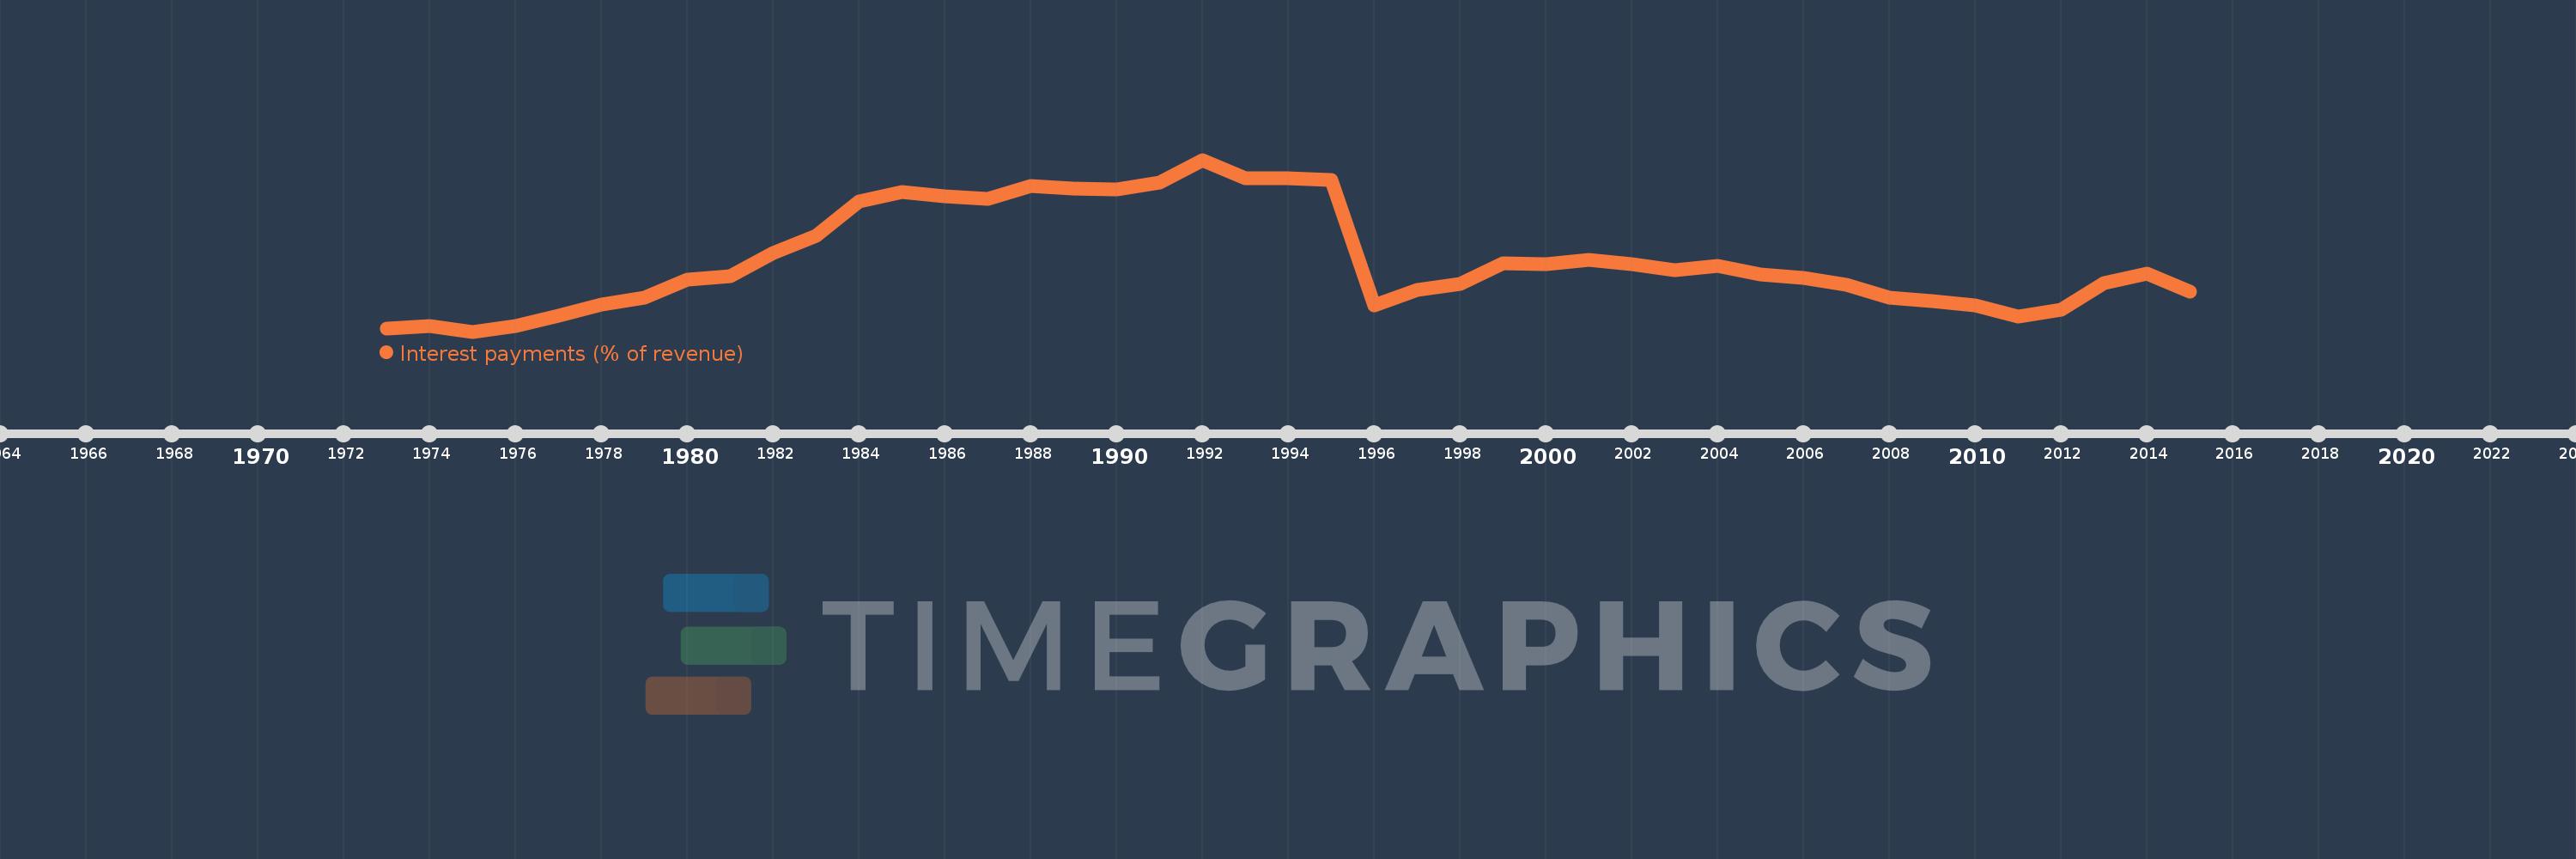
Interest payments (% of revenue)
2015,2014,2013,2012,2011,2010,2009,2008,2007,2006,2005,2004,2003,2002,2001,2000,1999,1998,1997,1996,1995,1994,1993,1992,1991,1990,1989,1988,1987,1986,1985,1984,1983,1982,1981,1980,1979,1978,1977,1976,1975,1974,1973
This statistics in other country:
AfghanistanAlbaniaAlgeriaAngolaAntigua and BarbudaArab WorldArmeniaAustraliaAustriaAzerbaijanBahamas, TheBahrainBangladeshBarbadosBelarusBelgiumBelizeBeninBhutanBoliviaBosnia and HerzegovinaBotswanaBrazilBulgariaBurkina FasoBurundiCabo VerdeCambodiaCanadaCaribbean small statesCentral African RepublicCentral Europe and the BalticsChileChinaColombiaCongo, Dem. Rep.Congo, Rep.Costa RicaCote d'IvoireCroatiaCyprusCzech RepublicDenmarkDominicaDominican RepublicEarly-demographic dividendEast Asia & PacificEast Asia & Pacific (excluding high income)East Asia & Pacific (IDA & IBRD countries)Egypt, Arab Rep.El SalvadorEquatorial GuineaEstoniaEthiopiaEuro areaEurope & Central AsiaEurope & Central Asia (excluding high income)Europe & Central Asia (IDA & IBRD countries)European UnionFijiFinlandFranceGambia, TheGeorgiaGermanyGhanaGreeceGrenadaGuatemalaHeavily indebted poor countries (HIPC)High incomeHondurasHong Kong SAR, ChinaHungaryIBRD onlyIcelandIDA & IBRD totalIDA blendIDA onlyIDA totalIndiaIndonesiaIran, Islamic Rep.IraqIrelandIsraelItalyJamaicaJapanJordanKazakhstanKenyaKiribatiKorea, Rep.KuwaitKyrgyz RepublicLao PDRLate-demographic dividendLatin America & Caribbean Latin America & Caribbean (excluding high income)Latin America & the Caribbean (IDA & IBRD countries)LatviaLeast developed countries: UN classificationLebanonLesothoLiberiaLithuaniaLow & middle incomeLow incomeLower middle incomeLuxembourgMacao SAR, ChinaMacedonia, FYRMadagascarMalawiMalaysiaMaldivesMaliMaltaMauritiusMexicoMicronesia, Fed. Sts.Middle East & North AfricaMiddle East & North Africa (excluding high income)Middle East & North Africa (IDA & IBRD countries)Middle incomeMoldovaMongoliaMoroccoMozambiqueNamibiaNepalNetherlandsNew ZealandNicaraguaNigeriaNorth AmericaNorwayOECD membersOmanOther small statesPakistanPanamaPapua New GuineaParaguayPeruPhilippinesPolandPortugalPost-demographic dividendPre-demographic dividendQatarRomaniaRussian FederationRwandaSamoaSan MarinoSao Tome and PrincipeSenegalSerbiaSeychellesSierra LeoneSingaporeSlovak RepublicSloveniaSmall statesSolomon IslandsSouth AfricaSouth AsiaSouth Asia (IDA & IBRD)SpainSri LankaSt. Kitts and NevisSt. LuciaSub-Saharan Africa Sub-Saharan Africa (excluding high income)Sub-Saharan Africa (IDA & IBRD countries)SurinameSwazilandSwedenSwitzerlandSyrian Arab RepublicTajikistanTanzaniaThailandTimor-LesteTogoTrinidad and TobagoTunisiaTurkeyUgandaUkraineUnited KingdomUnited StatesUpper middle incomeUruguayVanuatuVenezuela, RBVietnamWest Bank and GazaWorldYemen, Rep.ZambiaZimbabwe Timeline:
This timeline shows a graph from 1973 to 2015 of Cyprus. No data until 1972. Number of actual observations by date: 43.
Source name:
World Development Indicators
Source organization:
International Monetary Fund, Government Finance Statistics Yearbook and data files.
Categories, topics:
Public Sector
Last updated:
apr 23, 2017
Indicators value changes by year
Maximum:
17.875
jan 1, 1992
At the date of observation
Value
Absolute change
Change from previous value
jan 1, 1973
4.26
+4.26
0.0%
jan 1, 1974
4.46
+0.2
4.71%
jan 1, 1975
3.992
-0.468
-10.5%
jan 1, 1976
4.445
+0.453
11.34%
jan 1, 1977
5.248
+0.803
18.07%
jan 1, 1978
6.166
+0.918
17.49%
jan 1, 1979
6.716
+0.55
8.93%
jan 1, 1980
8.193
+1.477
21.99%
jan 1, 1981
8.461
+0.268
3.27%
jan 1, 1982
10.319
+1.858
21.96%
jan 1, 1983
11.721
+1.402
13.59%
jan 1, 1984
14.533
+2.811
23.98%
jan 1, 1985
15.244
+0.711
4.89%
jan 1, 1986
14.934
-0.31
-2.04%
jan 1, 1987
14.716
-0.217
-1.46%
jan 1, 1988
15.734
+1.018
6.92%
jan 1, 1989
15.583
-0.151
-0.96%
jan 1, 1990
15.473
-0.111
-0.71%
jan 1, 1991
16.065
+0.592
3.83%
jan 1, 1992
17.875
+1.81
11.27%
jan 1, 1993
16.393
-1.482
-8.29%
jan 1, 1994
16.416
+0.023
0.14%
jan 1, 1995
16.215
-0.201
-1.22%
jan 1, 1996
6.107
-10.108
-62.34%
jan 1, 1997
7.378
+1.271
20.82%
jan 1, 1998
7.814
+0.436
5.91%
jan 1, 1999
9.485
+1.671
21.38%
jan 1, 2000
9.474
-0.012
-0.12%
jan 1, 2001
9.774
+0.3
3.17%
jan 1, 2002
9.453
-0.321
-3.28%
jan 1, 2003
8.96
-0.493
-5.22%
jan 1, 2004
9.336
+0.376
4.2%
jan 1, 2005
8.639
-0.697
-7.46%
jan 1, 2006
8.351
-0.289
-3.34%
jan 1, 2007
7.747
-0.604
-7.23%
jan 1, 2008
6.727
-1.02
-13.17%
jan 1, 2009
6.485
-0.242
-3.6%
jan 1, 2010
6.124
-0.361
-5.57%
jan 1, 2011
5.221
-0.902
-14.73%
jan 1, 2012
5.728
+0.507
9.71%
jan 1, 2013
7.943
+2.215
38.67%
jan 1, 2014
8.712
+0.768
9.67%
jan 1, 2015
7.186
-1.526
-17.52%
Ranking of countries by current statistics by years


Comments: