29
/
en
AIzaSyAYiBZKx7MnpbEhh9jyipgxe19OcubqV5w
April 1, 2024
33542
European Union
EUU
false
2
1
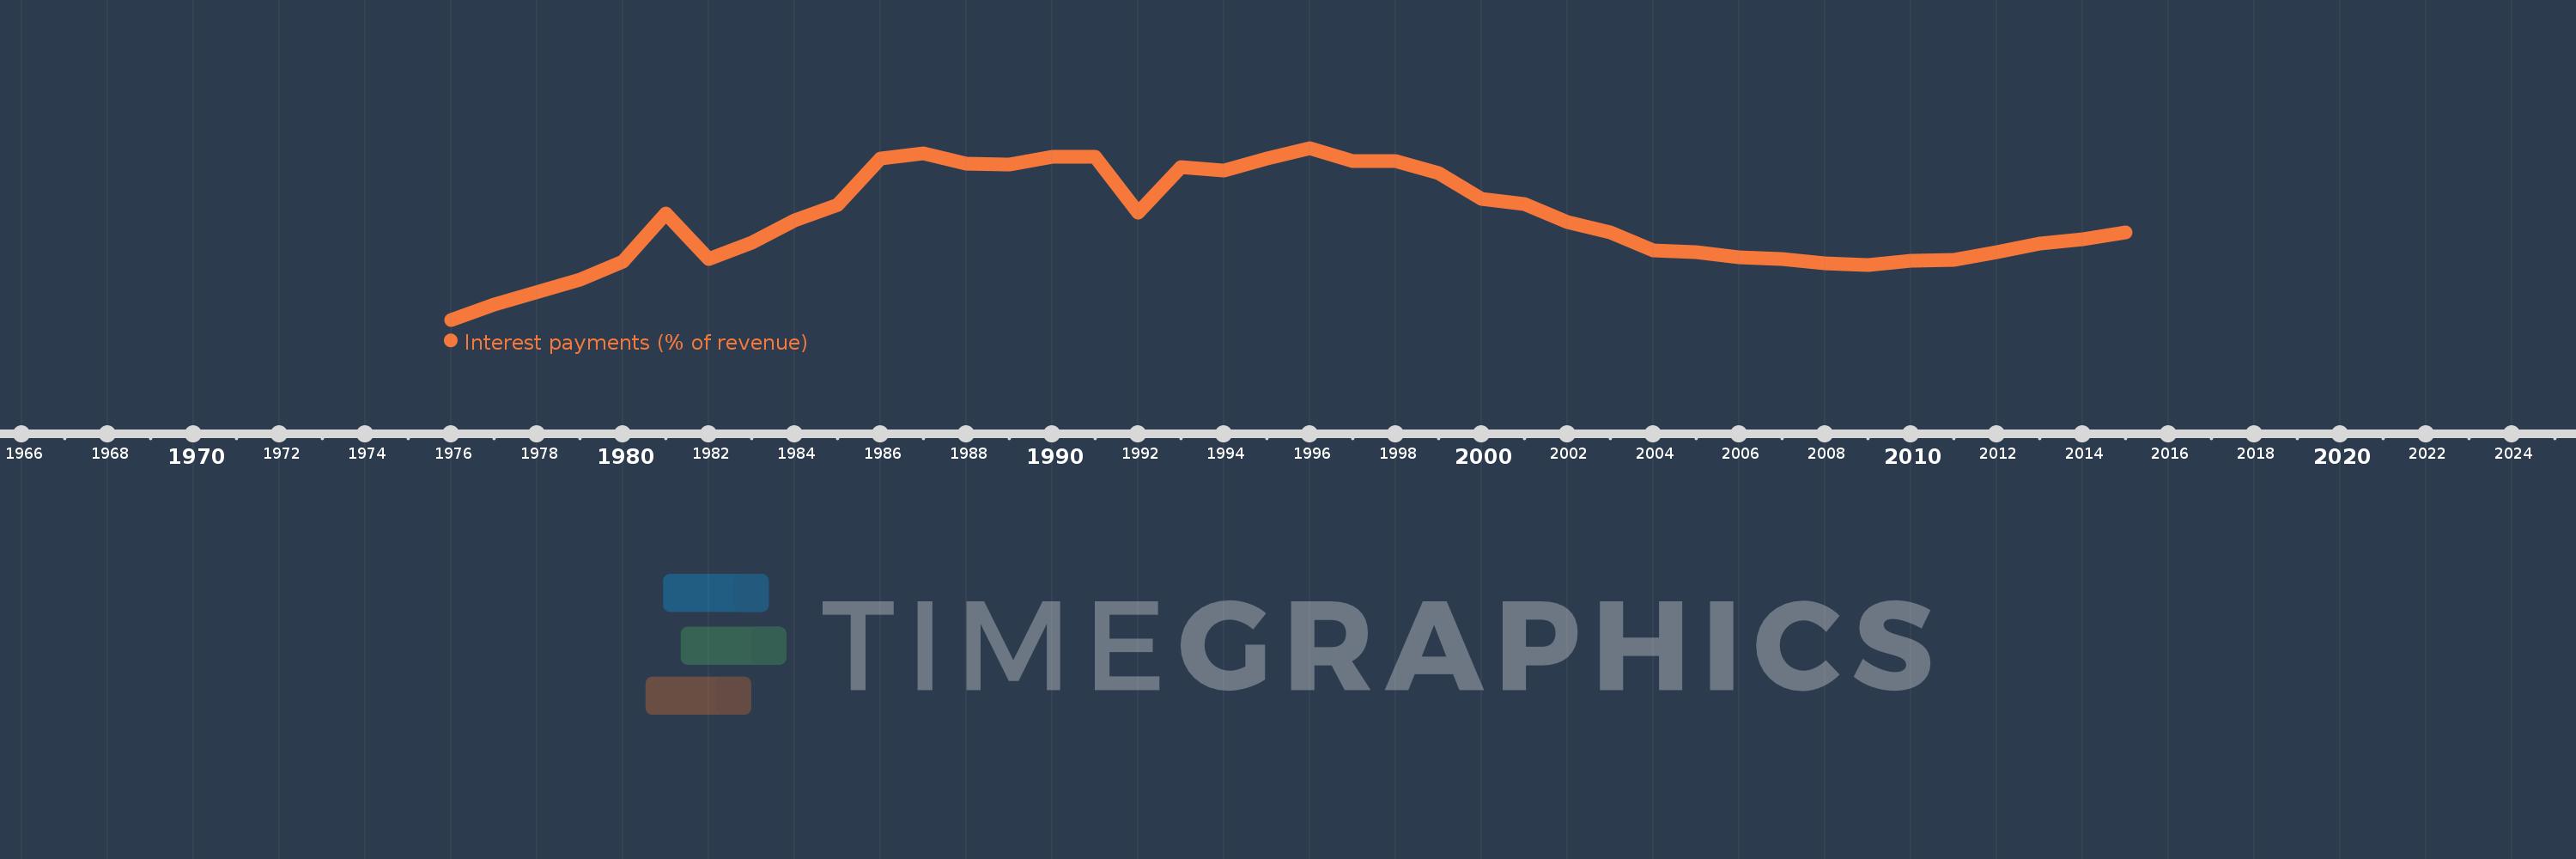
Interest payments (% of revenue)
2015,2014,2013,2012,2011,2010,2009,2008,2007,2006,2005,2004,2003,2002,2001,2000,1999,1998,1997,1996,1995,1994,1993,1992,1991,1990,1989,1988,1987,1986,1985,1984,1983,1982,1981,1980,1979,1977,1976
This statistics in other country:
AfghanistanAlbaniaAlgeriaAngolaAntigua and BarbudaArab WorldArmeniaAustraliaAustriaAzerbaijanBahamas, TheBahrainBangladeshBarbadosBelarusBelgiumBelizeBeninBhutanBoliviaBosnia and HerzegovinaBotswanaBrazilBulgariaBurkina FasoBurundiCabo VerdeCambodiaCanadaCaribbean small statesCentral African RepublicCentral Europe and the BalticsChileChinaColombiaCongo, Dem. Rep.Congo, Rep.Costa RicaCote d'IvoireCroatiaCyprusCzech RepublicDenmarkDominicaDominican RepublicEarly-demographic dividendEast Asia & PacificEast Asia & Pacific (excluding high income)East Asia & Pacific (IDA & IBRD countries)Egypt, Arab Rep.El SalvadorEquatorial GuineaEstoniaEthiopiaEuro areaEurope & Central AsiaEurope & Central Asia (excluding high income)Europe & Central Asia (IDA & IBRD countries)European UnionFijiFinlandFranceGambia, TheGeorgiaGermanyGhanaGreeceGrenadaGuatemalaHeavily indebted poor countries (HIPC)High incomeHondurasHong Kong SAR, ChinaHungaryIBRD onlyIcelandIDA & IBRD totalIDA blendIDA onlyIDA totalIndiaIndonesiaIran, Islamic Rep.IraqIrelandIsraelItalyJamaicaJapanJordanKazakhstanKenyaKiribatiKorea, Rep.KuwaitKyrgyz RepublicLao PDRLate-demographic dividendLatin America & Caribbean Latin America & Caribbean (excluding high income)Latin America & the Caribbean (IDA & IBRD countries)LatviaLeast developed countries: UN classificationLebanonLesothoLiberiaLithuaniaLow & middle incomeLow incomeLower middle incomeLuxembourgMacao SAR, ChinaMacedonia, FYRMadagascarMalawiMalaysiaMaldivesMaliMaltaMauritiusMexicoMicronesia, Fed. Sts.Middle East & North AfricaMiddle East & North Africa (excluding high income)Middle East & North Africa (IDA & IBRD countries)Middle incomeMoldovaMongoliaMoroccoMozambiqueNamibiaNepalNetherlandsNew ZealandNicaraguaNigeriaNorth AmericaNorwayOECD membersOmanOther small statesPakistanPanamaPapua New GuineaParaguayPeruPhilippinesPolandPortugalPost-demographic dividendPre-demographic dividendQatarRomaniaRussian FederationRwandaSamoaSan MarinoSao Tome and PrincipeSenegalSerbiaSeychellesSierra LeoneSingaporeSlovak RepublicSloveniaSmall statesSolomon IslandsSouth AfricaSouth AsiaSouth Asia (IDA & IBRD)SpainSri LankaSt. Kitts and NevisSt. LuciaSub-Saharan Africa Sub-Saharan Africa (excluding high income)Sub-Saharan Africa (IDA & IBRD countries)SurinameSwazilandSwedenSwitzerlandSyrian Arab RepublicTajikistanTanzaniaThailandTimor-LesteTogoTrinidad and TobagoTunisiaTurkeyUgandaUkraineUnited KingdomUnited StatesUpper middle incomeUruguayVanuatuVenezuela, RBVietnamWest Bank and GazaWorldYemen, Rep.ZambiaZimbabwe Timeline:
This timeline shows a graph from 1976 to 2015 of European Union. No data until 1975. Number of actual observations by date: 39.
Source name:
World Development Indicators
Source organization:
International Monetary Fund, Government Finance Statistics Yearbook and data files.
Categories, topics:
Public Sector
Last updated:
apr 23, 2017
Indicators value changes by year
Maximum:
10.377
jan 1, 1996
At the date of observation
Value
Absolute change
Change from previous value
jan 1, 1976
2.671
+2.671
0.0%
jan 1, 1977
3.361
+0.69
25.85%
jan 1, 1979
4.475
+1.114
33.13%
jan 1, 1980
5.283
+0.808
18.07%
jan 1, 1981
7.437
+2.154
40.77%
jan 1, 1982
5.397
-2.04
-27.43%
jan 1, 1983
6.144
+0.747
13.84%
jan 1, 1984
7.132
+0.988
16.08%
jan 1, 1985
7.805
+0.674
9.44%
jan 1, 1986
9.884
+2.078
26.62%
jan 1, 1987
10.14
+0.256
2.59%
jan 1, 1988
9.685
-0.455
-4.49%
jan 1, 1989
9.642
-0.042
-0.44%
jan 1, 1990
9.967
+0.324
3.36%
jan 1, 1991
9.968
+0.001
0.01%
jan 1, 1992
7.49
-2.478
-24.86%
jan 1, 1993
9.534
+2.045
27.3%
jan 1, 1994
9.365
-0.17
-1.78%
jan 1, 1995
9.914
+0.549
5.86%
jan 1, 1996
10.377
+0.463
4.67%
jan 1, 1997
9.796
-0.581
-5.6%
jan 1, 1998
9.789
-0.007
-0.07%
jan 1, 1999
9.25
-0.539
-5.51%
jan 1, 2000
8.079
-1.171
-12.66%
jan 1, 2001
7.85
-0.229
-2.84%
jan 1, 2002
7.067
-0.783
-9.97%
jan 1, 2003
6.604
-0.462
-6.54%
jan 1, 2004
5.775
-0.829
-12.56%
jan 1, 2005
5.693
-0.082
-1.42%
jan 1, 2006
5.472
-0.221
-3.88%
jan 1, 2007
5.403
-0.069
-1.26%
jan 1, 2008
5.216
-0.188
-3.48%
jan 1, 2009
5.142
-0.073
-1.4%
jan 1, 2010
5.312
+0.17
3.3%
jan 1, 2011
5.364
+0.052
0.97%
jan 1, 2012
5.706
+0.342
6.38%
jan 1, 2013
6.107
+0.401
7.02%
jan 1, 2014
6.275
+0.168
2.75%
jan 1, 2015
6.601
+0.326
5.2%
Ranking of countries by current statistics by years


Comments: