29
/
en
AIzaSyAYiBZKx7MnpbEhh9jyipgxe19OcubqV5w
April 1, 2024
112418
Costa Rica
CRI
true
2
1
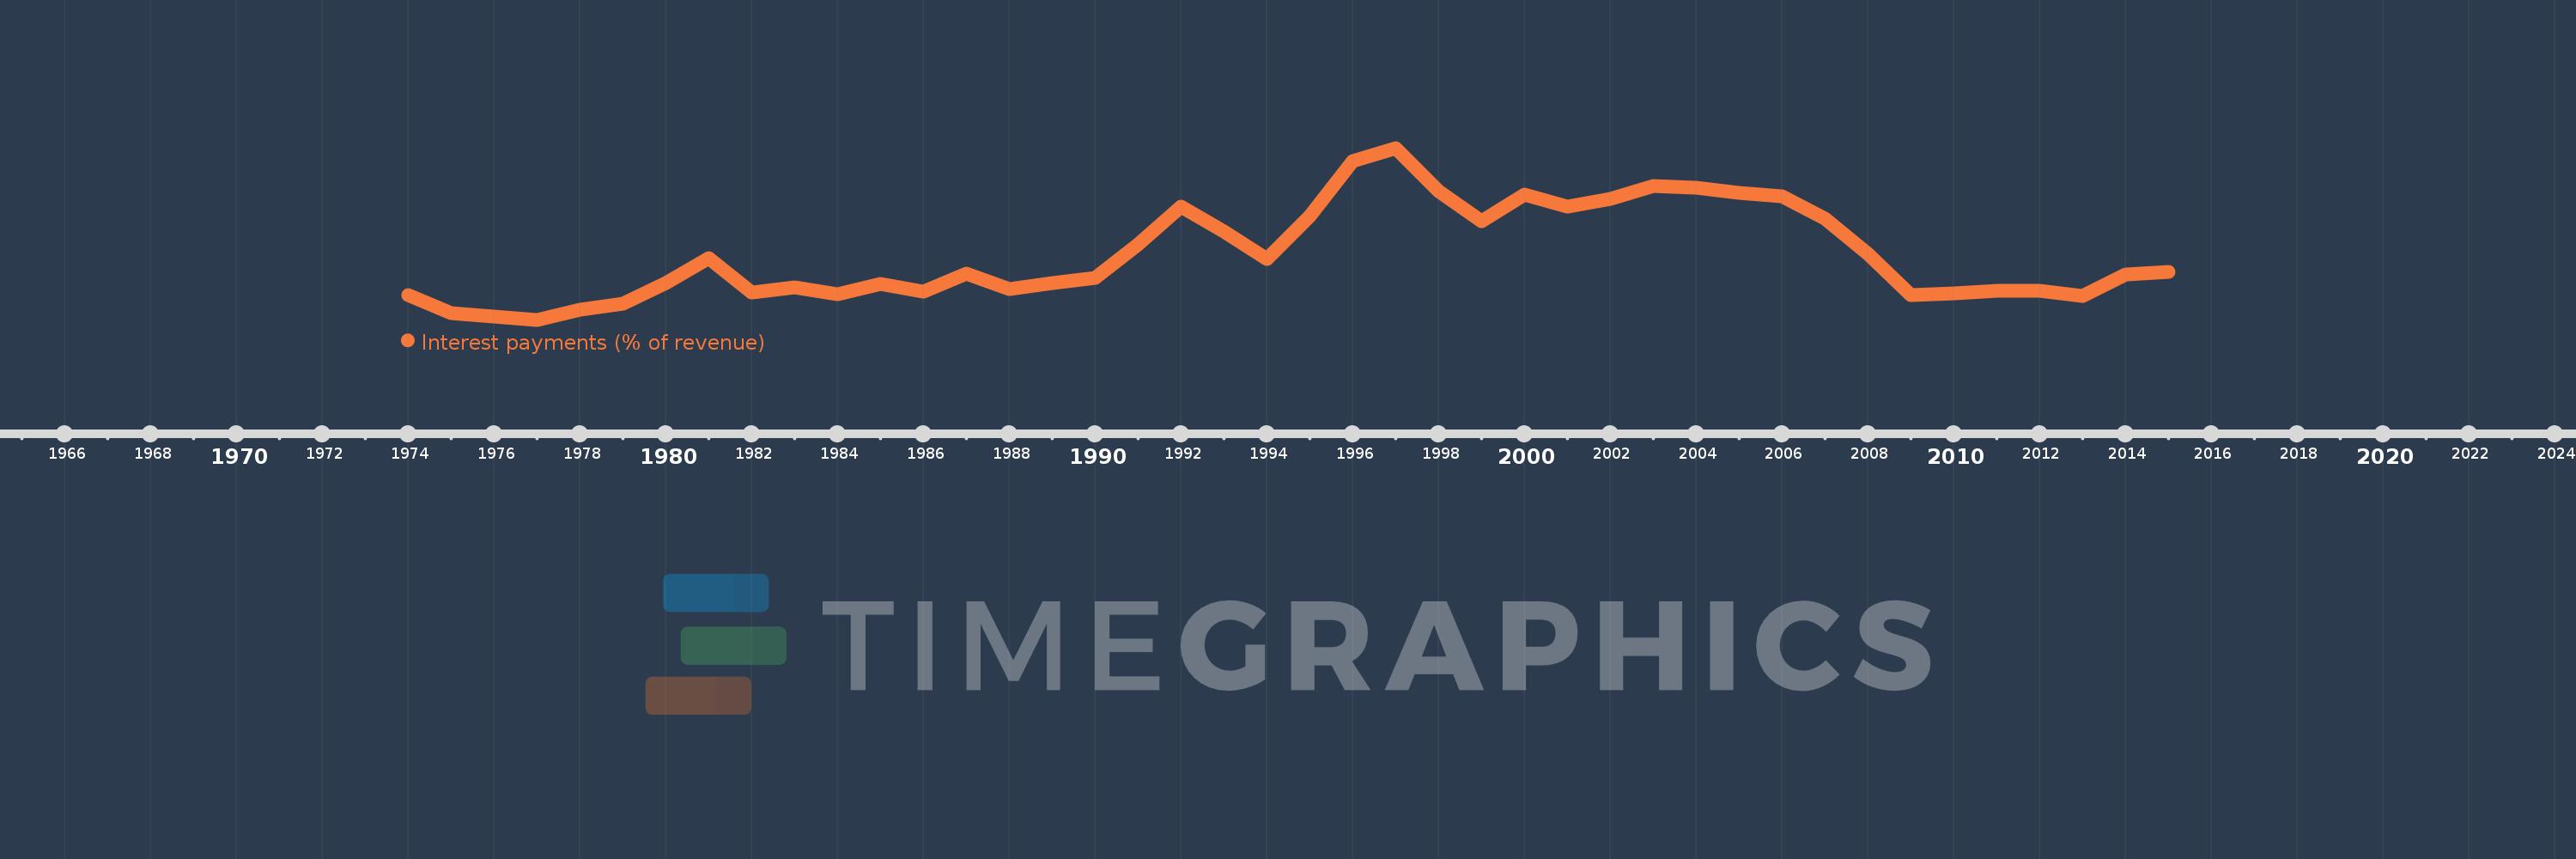
Interest payments (% of revenue)
2015,2014,2013,2012,2011,2010,2009,2008,2007,2006,2005,2004,2003,2002,2001,2000,1999,1998,1997,1996,1995,1994,1993,1992,1991,1990,1989,1988,1987,1986,1985,1984,1983,1982,1981,1980,1979,1978,1977,1976,1975,1974
This statistics in other country:
AfghanistanAlbaniaAlgeriaAngolaAntigua and BarbudaArab WorldArmeniaAustraliaAustriaAzerbaijanBahamas, TheBahrainBangladeshBarbadosBelarusBelgiumBelizeBeninBhutanBoliviaBosnia and HerzegovinaBotswanaBrazilBulgariaBurkina FasoBurundiCabo VerdeCambodiaCanadaCaribbean small statesCentral African RepublicCentral Europe and the BalticsChileChinaColombiaCongo, Dem. Rep.Congo, Rep.Costa RicaCote d'IvoireCroatiaCyprusCzech RepublicDenmarkDominicaDominican RepublicEarly-demographic dividendEast Asia & PacificEast Asia & Pacific (excluding high income)East Asia & Pacific (IDA & IBRD countries)Egypt, Arab Rep.El SalvadorEquatorial GuineaEstoniaEthiopiaEuro areaEurope & Central AsiaEurope & Central Asia (excluding high income)Europe & Central Asia (IDA & IBRD countries)European UnionFijiFinlandFranceGambia, TheGeorgiaGermanyGhanaGreeceGrenadaGuatemalaHeavily indebted poor countries (HIPC)High incomeHondurasHong Kong SAR, ChinaHungaryIBRD onlyIcelandIDA & IBRD totalIDA blendIDA onlyIDA totalIndiaIndonesiaIran, Islamic Rep.IraqIrelandIsraelItalyJamaicaJapanJordanKazakhstanKenyaKiribatiKorea, Rep.KuwaitKyrgyz RepublicLao PDRLate-demographic dividendLatin America & Caribbean Latin America & Caribbean (excluding high income)Latin America & the Caribbean (IDA & IBRD countries)LatviaLeast developed countries: UN classificationLebanonLesothoLiberiaLithuaniaLow & middle incomeLow incomeLower middle incomeLuxembourgMacao SAR, ChinaMacedonia, FYRMadagascarMalawiMalaysiaMaldivesMaliMaltaMauritiusMexicoMicronesia, Fed. Sts.Middle East & North AfricaMiddle East & North Africa (excluding high income)Middle East & North Africa (IDA & IBRD countries)Middle incomeMoldovaMongoliaMoroccoMozambiqueNamibiaNepalNetherlandsNew ZealandNicaraguaNigeriaNorth AmericaNorwayOECD membersOmanOther small statesPakistanPanamaPapua New GuineaParaguayPeruPhilippinesPolandPortugalPost-demographic dividendPre-demographic dividendQatarRomaniaRussian FederationRwandaSamoaSan MarinoSao Tome and PrincipeSenegalSerbiaSeychellesSierra LeoneSingaporeSlovak RepublicSloveniaSmall statesSolomon IslandsSouth AfricaSouth AsiaSouth Asia (IDA & IBRD)SpainSri LankaSt. Kitts and NevisSt. LuciaSub-Saharan Africa Sub-Saharan Africa (excluding high income)Sub-Saharan Africa (IDA & IBRD countries)SurinameSwazilandSwedenSwitzerlandSyrian Arab RepublicTajikistanTanzaniaThailandTimor-LesteTogoTrinidad and TobagoTunisiaTurkeyUgandaUkraineUnited KingdomUnited StatesUpper middle incomeUruguayVanuatuVenezuela, RBVietnamWest Bank and GazaWorldYemen, Rep.ZambiaZimbabwe Timeline:
This timeline shows a graph from 1974 to 2015 of Costa Rica. No data until 1973. Number of actual observations by date: 42.
Source name:
World Development Indicators
Source organization:
International Monetary Fund, Government Finance Statistics Yearbook and data files.
Categories, topics:
Public Sector
Last updated:
apr 23, 2017
Indicators value changes by year
Maximum:
22.648
jan 1, 1997
At the date of observation
Value
Absolute change
Change from previous value
jan 1, 1974
8.642
+8.642
0.0%
jan 1, 1975
6.939
-1.703
-19.71%
jan 1, 1976
6.601
-0.338
-4.87%
jan 1, 1977
6.301
-0.299
-4.53%
jan 1, 1978
7.289
+0.988
15.68%
jan 1, 1979
7.826
+0.537
7.36%
jan 1, 1980
9.81
+1.984
25.35%
jan 1, 1981
12.195
+2.385
24.31%
jan 1, 1982
8.93
-3.265
-26.77%
jan 1, 1983
9.395
+0.465
5.21%
jan 1, 1984
8.751
-0.644
-6.85%
jan 1, 1985
9.676
+0.924
10.56%
jan 1, 1986
8.949
-0.727
-7.51%
jan 1, 1987
10.685
+1.736
19.4%
jan 1, 1988
9.232
-1.453
-13.6%
jan 1, 1989
9.804
+0.572
6.19%
jan 1, 1990
10.302
+0.498
5.08%
jan 1, 1991
13.43
+3.128
30.37%
jan 1, 1992
17.044
+3.614
26.91%
jan 1, 1993
14.697
-2.347
-13.77%
jan 1, 1994
12.059
-2.638
-17.95%
jan 1, 1995
16.205
+4.147
34.39%
jan 1, 1996
21.359
+5.154
31.81%
jan 1, 1997
22.648
+1.288
6.03%
jan 1, 1998
18.527
-4.121
-18.19%
jan 1, 1999
15.695
-2.832
-15.29%
jan 1, 2000
18.187
+2.493
15.88%
jan 1, 2001
17.087
-1.1
-6.05%
jan 1, 2002
17.775
+0.688
4.03%
jan 1, 2003
19.012
+1.237
6.96%
jan 1, 2004
18.9
-0.112
-0.59%
jan 1, 2005
18.343
-0.557
-2.95%
jan 1, 2006
18.025
-0.318
-1.73%
jan 1, 2007
15.932
-2.093
-11.61%
jan 1, 2008
12.554
-3.378
-21.2%
jan 1, 2009
8.637
-3.917
-31.2%
jan 1, 2010
8.797
+0.159
1.85%
jan 1, 2011
9.037
+0.24
2.73%
jan 1, 2012
9.044
+0.008
0.09%
jan 1, 2013
8.591
-0.453
-5.01%
jan 1, 2014
10.569
+1.978
23.03%
jan 1, 2015
10.819
+0.25
2.37%
Ranking of countries by current statistics by years


Comments: