29
/
en
AIzaSyAYiBZKx7MnpbEhh9jyipgxe19OcubqV5w
April 1, 2024
161620
Italy
ITA
true
2
1
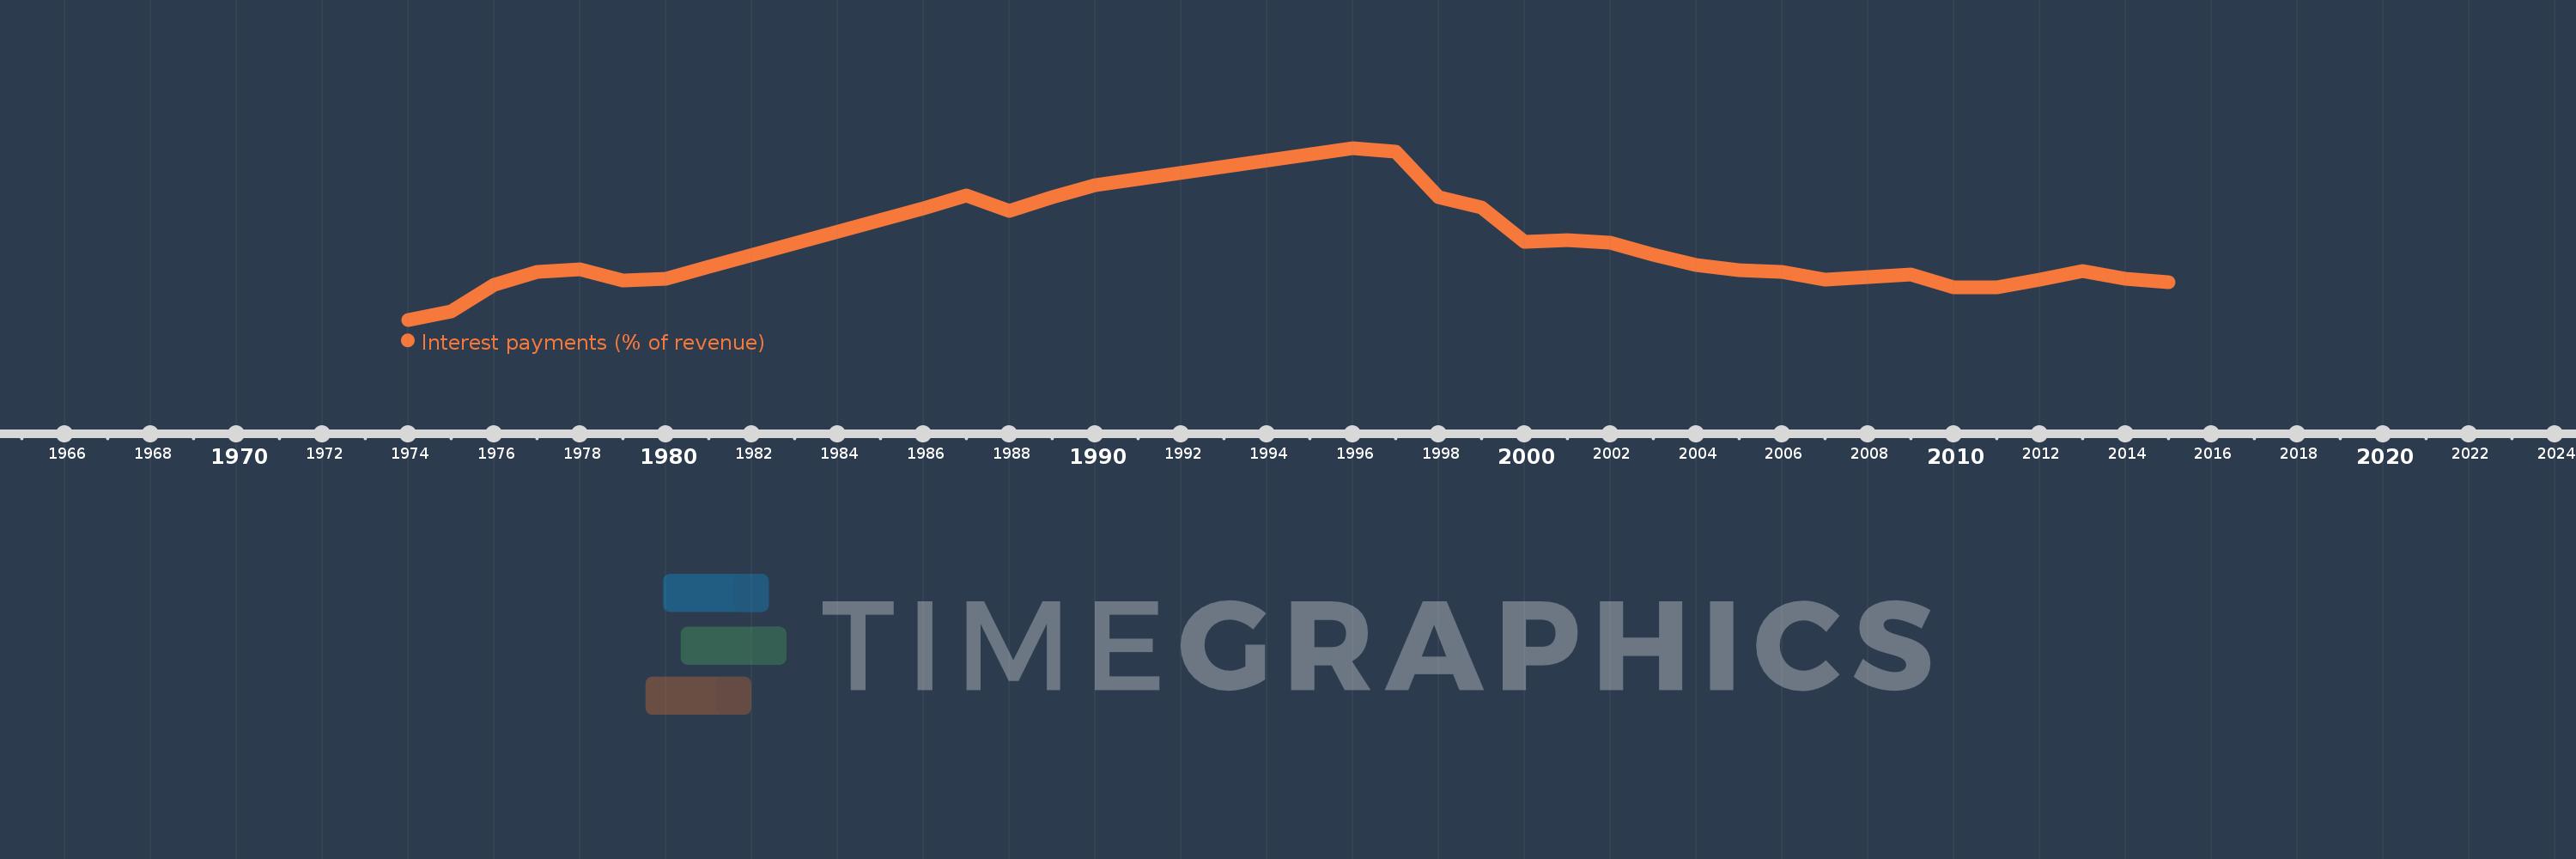
Interest payments (% of revenue)
2015,2014,2013,2012,2011,2010,2009,2008,2007,2006,2005,2004,2003,2002,2001,2000,1999,1998,1997,1996,1990,1989,1988,1987,1986,1981,1980,1979,1978,1977,1976,1975,1974
This statistics in other country:
AfghanistanAlbaniaAlgeriaAngolaAntigua and BarbudaArab WorldArmeniaAustraliaAustriaAzerbaijanBahamas, TheBahrainBangladeshBarbadosBelarusBelgiumBelizeBeninBhutanBoliviaBosnia and HerzegovinaBotswanaBrazilBulgariaBurkina FasoBurundiCabo VerdeCambodiaCanadaCaribbean small statesCentral African RepublicCentral Europe and the BalticsChileChinaColombiaCongo, Dem. Rep.Congo, Rep.Costa RicaCote d'IvoireCroatiaCyprusCzech RepublicDenmarkDominicaDominican RepublicEarly-demographic dividendEast Asia & PacificEast Asia & Pacific (excluding high income)East Asia & Pacific (IDA & IBRD countries)Egypt, Arab Rep.El SalvadorEquatorial GuineaEstoniaEthiopiaEuro areaEurope & Central AsiaEurope & Central Asia (excluding high income)Europe & Central Asia (IDA & IBRD countries)European UnionFijiFinlandFranceGambia, TheGeorgiaGermanyGhanaGreeceGrenadaGuatemalaHeavily indebted poor countries (HIPC)High incomeHondurasHong Kong SAR, ChinaHungaryIBRD onlyIcelandIDA & IBRD totalIDA blendIDA onlyIDA totalIndiaIndonesiaIran, Islamic Rep.IraqIrelandIsraelItalyJamaicaJapanJordanKazakhstanKenyaKiribatiKorea, Rep.KuwaitKyrgyz RepublicLao PDRLate-demographic dividendLatin America & Caribbean Latin America & Caribbean (excluding high income)Latin America & the Caribbean (IDA & IBRD countries)LatviaLeast developed countries: UN classificationLebanonLesothoLiberiaLithuaniaLow & middle incomeLow incomeLower middle incomeLuxembourgMacao SAR, ChinaMacedonia, FYRMadagascarMalawiMalaysiaMaldivesMaliMaltaMauritiusMexicoMicronesia, Fed. Sts.Middle East & North AfricaMiddle East & North Africa (excluding high income)Middle East & North Africa (IDA & IBRD countries)Middle incomeMoldovaMongoliaMoroccoMozambiqueNamibiaNepalNetherlandsNew ZealandNicaraguaNigeriaNorth AmericaNorwayOECD membersOmanOther small statesPakistanPanamaPapua New GuineaParaguayPeruPhilippinesPolandPortugalPost-demographic dividendPre-demographic dividendQatarRomaniaRussian FederationRwandaSamoaSan MarinoSao Tome and PrincipeSenegalSerbiaSeychellesSierra LeoneSingaporeSlovak RepublicSloveniaSmall statesSolomon IslandsSouth AfricaSouth AsiaSouth Asia (IDA & IBRD)SpainSri LankaSt. Kitts and NevisSt. LuciaSub-Saharan Africa Sub-Saharan Africa (excluding high income)Sub-Saharan Africa (IDA & IBRD countries)SurinameSwazilandSwedenSwitzerlandSyrian Arab RepublicTajikistanTanzaniaThailandTimor-LesteTogoTrinidad and TobagoTunisiaTurkeyUgandaUkraineUnited KingdomUnited StatesUpper middle incomeUruguayVanuatuVenezuela, RBVietnamWest Bank and GazaWorldYemen, Rep.ZambiaZimbabwe Timeline:
This timeline shows a graph from 1974 to 2015 of Italy. No data until 1973. Number of actual observations by date: 33.
Source name:
World Development Indicators
Source organization:
International Monetary Fund, Government Finance Statistics Yearbook and data files.
Categories, topics:
Public Sector
Last updated:
apr 23, 2017
Indicators value changes by year
Maximum:
27.495
jan 1, 1996
At the date of observation
Value
Absolute change
Change from previous value
jan 1, 1974
7.29
+7.29
0.0%
jan 1, 1975
8.309
+1.019
13.97%
jan 1, 1976
11.451
+3.142
37.82%
jan 1, 1977
12.895
+1.444
12.61%
jan 1, 1978
13.257
+0.362
2.81%
jan 1, 1979
11.878
-1.378
-10.4%
jan 1, 1980
12.089
+0.21
1.77%
jan 1, 1981
13.547
+1.458
12.06%
jan 1, 1986
20.443
+6.896
50.91%
jan 1, 1987
21.909
+1.466
7.17%
jan 1, 1988
20.112
-1.797
-8.2%
jan 1, 1989
21.755
+1.643
8.17%
jan 1, 1990
23.072
+1.317
6.05%
jan 1, 1996
27.495
+4.423
19.17%
jan 1, 1997
27.067
-0.428
-1.56%
jan 1, 1998
21.7
-5.367
-19.83%
jan 1, 1999
20.527
-1.173
-5.41%
jan 1, 2000
16.491
-4.036
-19.66%
jan 1, 2001
16.634
+0.144
0.87%
jan 1, 2002
16.396
-0.238
-1.43%
jan 1, 2003
14.982
-1.414
-8.63%
jan 1, 2004
13.699
-1.283
-8.56%
jan 1, 2005
13.107
-0.592
-4.32%
jan 1, 2006
12.881
-0.226
-1.72%
jan 1, 2007
11.981
-0.9
-6.99%
jan 1, 2008
12.266
+0.285
2.38%
jan 1, 2009
12.638
+0.372
3.03%
jan 1, 2010
11.108
-1.53
-12.1%
jan 1, 2011
11.083
-0.025
-0.23%
jan 1, 2012
12.041
+0.958
8.64%
jan 1, 2013
13.057
+1.016
8.43%
jan 1, 2014
12.157
-0.9
-6.89%
jan 1, 2015
11.697
-0.46
-3.79%
Ranking of countries by current statistics by years


Comments: