29
/
en
AIzaSyAYiBZKx7MnpbEhh9jyipgxe19OcubqV5w
April 1, 2024
49546
Middle East & North Africa (excluding high income)
MNA
false
2
1
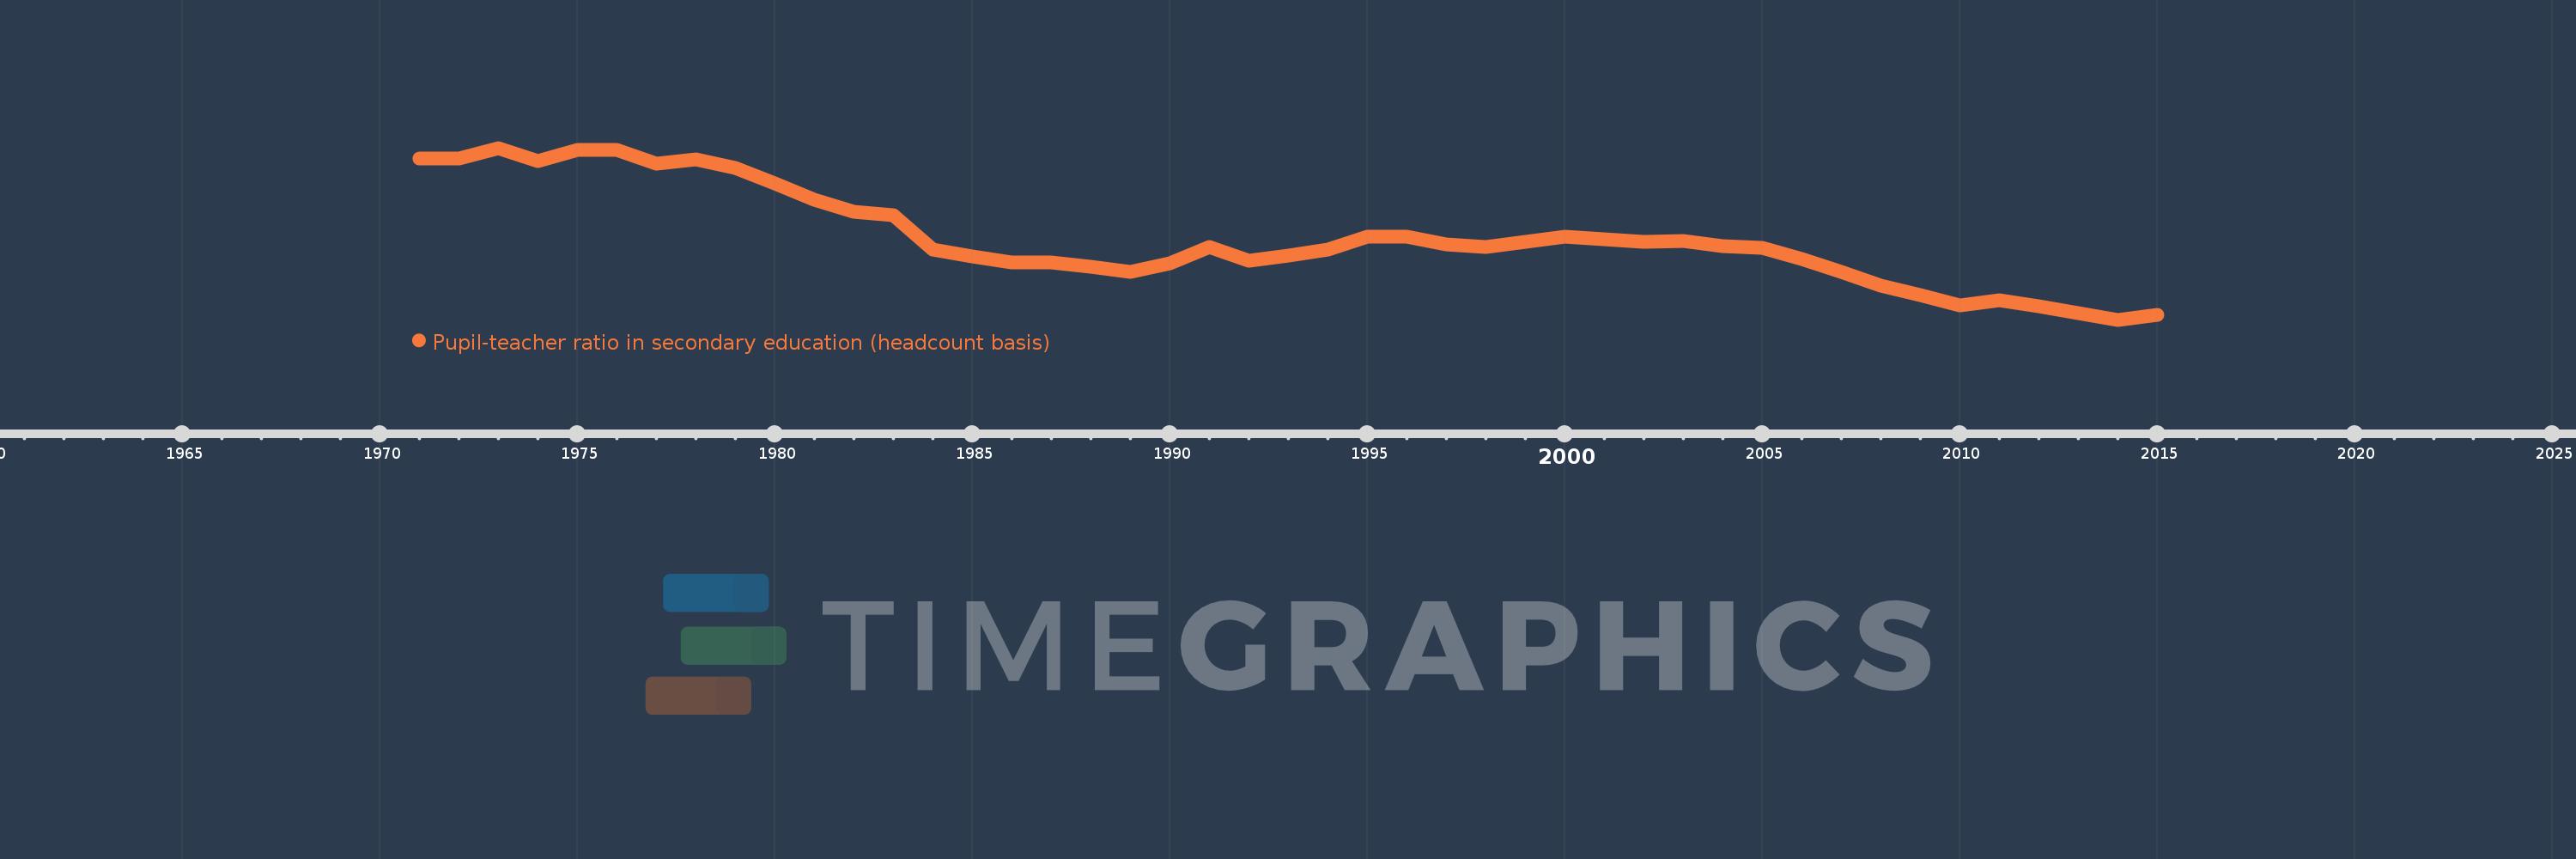
Pupil-teacher ratio in secondary education (headcount basis)
2015,2014,2013,2012,2011,2010,2009,2008,2007,2006,2005,2004,2003,2002,2001,2000,1999,1998,1997,1996,1995,1994,1993,1992,1991,1990,1989,1988,1987,1986,1985,1984,1983,1982,1981,1980,1979,1978,1977,1976,1975,1974,1973,1972,1971
This statistics in other country:
AfghanistanAlbaniaAlgeriaAndorraAngolaAntigua and BarbudaArab WorldArgentinaArmeniaArubaAustriaBahamas, TheBahrainBangladeshBarbadosBelarusBelgiumBelizeBeninBermudaBhutanBoliviaBosnia and HerzegovinaBotswanaBrazilBritish Virgin IslandsBrunei DarussalamBulgariaBurkina FasoBurundiCabo VerdeCambodiaCameroonCanadaCaribbean small statesCayman IslandsCentral African RepublicCentral Europe and the BalticsChadChileChinaColombiaComorosCongo, Dem. Rep.Congo, Rep.Costa RicaCote d'IvoireCroatiaCubaCyprusCzech RepublicDenmarkDjiboutiDominicaDominican RepublicEarly-demographic dividendEast Asia & PacificEast Asia & Pacific (excluding high income)East Asia & Pacific (IDA & IBRD countries)EcuadorEgypt, Arab Rep.El SalvadorEquatorial GuineaEritreaEstoniaEthiopiaEuro areaEurope & Central AsiaEurope & Central Asia (excluding high income)Europe & Central Asia (IDA & IBRD countries)European UnionFijiFinlandFragile and conflict affected situationsFranceGabonGambia, TheGeorgiaGermanyGhanaGibraltarGreeceGrenadaGuatemalaGuineaGuinea-BissauGuyanaHaitiHeavily indebted poor countries (HIPC)High incomeHondurasHong Kong SAR, ChinaHungaryIBRD onlyIcelandIDA & IBRD totalIDA blendIDA onlyIDA totalIndiaIndonesiaIran, Islamic Rep.IraqIrelandIsraelItalyJamaicaJapanJordanKazakhstanKenyaKiribatiKorea, Dem. People’s Rep.Korea, Rep.KuwaitKyrgyz RepublicLao PDRLate-demographic dividendLatin America & Caribbean Latin America & Caribbean (excluding high income)Latin America & the Caribbean (IDA & IBRD countries)LatviaLeast developed countries: UN classificationLebanonLesothoLiberiaLibyaLiechtensteinLithuaniaLow & middle incomeLow incomeLower middle incomeLuxembourgMacao SAR, ChinaMacedonia, FYRMadagascarMalawiMalaysiaMaldivesMaliMaltaMarshall IslandsMauritaniaMauritiusMexicoMiddle East & North AfricaMiddle East & North Africa (excluding high income)Middle East & North Africa (IDA & IBRD countries)Middle incomeMoldovaMonacoMongoliaMoroccoMozambiqueMyanmarNamibiaNauruNepalNetherlandsNew ZealandNicaraguaNigerNigeriaNorth AmericaNorwayOECD membersOmanOther small statesPacific island small statesPakistanPalauPanamaPapua New GuineaParaguayPeruPhilippinesPolandPortugalPost-demographic dividendPre-demographic dividendPuerto RicoQatarRomaniaRussian FederationRwandaSamoaSan MarinoSao Tome and PrincipeSaudi ArabiaSenegalSerbiaSeychellesSierra LeoneSingaporeSint Maarten (Dutch part)Slovak RepublicSloveniaSmall statesSolomon IslandsSomaliaSouth AfricaSouth AsiaSouth Asia (IDA & IBRD)SpainSri LankaSt. Kitts and NevisSt. LuciaSt. Vincent and the GrenadinesSub-Saharan Africa Sub-Saharan Africa (excluding high income)Sub-Saharan Africa (IDA & IBRD countries)SudanSurinameSwazilandSwedenSwitzerlandSyrian Arab RepublicTajikistanTanzaniaThailandTimor-LesteTogoTongaTrinidad and TobagoTunisiaTurkeyTurks and Caicos IslandsUgandaUkraineUnited Arab EmiratesUnited KingdomUnited StatesUpper middle incomeUruguayUzbekistanVanuatuVenezuela, RBVietnamWest Bank and GazaWorldYemen, Rep.ZambiaZimbabwe Timeline:
This timeline shows a graph from 1971 to 2015 of Middle East & North Africa (excluding high income). No data until 1970. Number of actual observations by date: 45.
Source name:
World Development Indicators
Source organization:
UNESCO Institute for Statistics
Categories, topics:
Education
Last updated:
apr 23, 2017
Indicators value changes by year
Minimum:
15.838
jan 1, 2014
Maximum:
24.584
jan 1, 1973
At the date of observation
Value
Absolute change
Change from previous value
jan 1, 1971
24.039
+24.039
0.0%
jan 1, 1972
24.039
+0.0
0.0%
jan 1, 1973
24.584
+0.544
2.26%
jan 1, 1974
23.9
-0.684
-2.78%
jan 1, 1975
24.477
+0.577
2.41%
jan 1, 1976
24.495
+0.018
0.07%
jan 1, 1977
23.784
-0.711
-2.9%
jan 1, 1978
24.006
+0.223
0.94%
jan 1, 1979
23.577
-0.429
-1.79%
jan 1, 1980
22.776
-0.802
-3.4%
jan 1, 1981
21.948
-0.828
-3.63%
jan 1, 1982
21.344
-0.604
-2.75%
jan 1, 1983
21.148
-0.196
-0.92%
jan 1, 1984
19.39
-1.758
-8.31%
jan 1, 1985
19.066
-0.323
-1.67%
jan 1, 1986
18.735
-0.331
-1.74%
jan 1, 1987
18.738
+0.003
0.01%
jan 1, 1988
18.538
-0.2
-1.07%
jan 1, 1989
18.289
-0.25
-1.35%
jan 1, 1990
18.727
+0.438
2.4%
jan 1, 1991
19.55
+0.823
4.4%
jan 1, 1992
18.857
-0.693
-3.54%
jan 1, 1993
19.1
+0.243
1.29%
jan 1, 1994
19.404
+0.304
1.59%
jan 1, 1995
20.055
+0.651
3.36%
jan 1, 1996
20.086
+0.031
0.15%
jan 1, 1997
19.653
-0.433
-2.15%
jan 1, 1998
19.531
-0.123
-0.62%
jan 1, 1999
19.818
+0.288
1.47%
jan 1, 2000
20.086
+0.267
1.35%
jan 1, 2001
19.948
-0.138
-0.69%
jan 1, 2002
19.812
-0.136
-0.68%
jan 1, 2003
19.867
+0.056
0.28%
jan 1, 2004
19.596
-0.272
-1.37%
jan 1, 2005
19.519
-0.077
-0.39%
jan 1, 2006
18.923
-0.596
-3.05%
jan 1, 2007
18.295
-0.628
-3.32%
jan 1, 2008
17.571
-0.724
-3.96%
jan 1, 2009
17.078
-0.493
-2.81%
jan 1, 2010
16.583
-0.495
-2.9%
jan 1, 2011
16.833
+0.25
1.51%
jan 1, 2012
16.532
-0.301
-1.79%
jan 1, 2013
16.16
-0.372
-2.25%
jan 1, 2014
15.838
-0.322
-1.99%
jan 1, 2015
16.07
+0.231
1.46%
Ranking of countries by current statistics by years


Comments: