29
/
en
AIzaSyAYiBZKx7MnpbEhh9jyipgxe19OcubqV5w
April 1, 2024
45619
Low & middle income
LMY
false
2
1
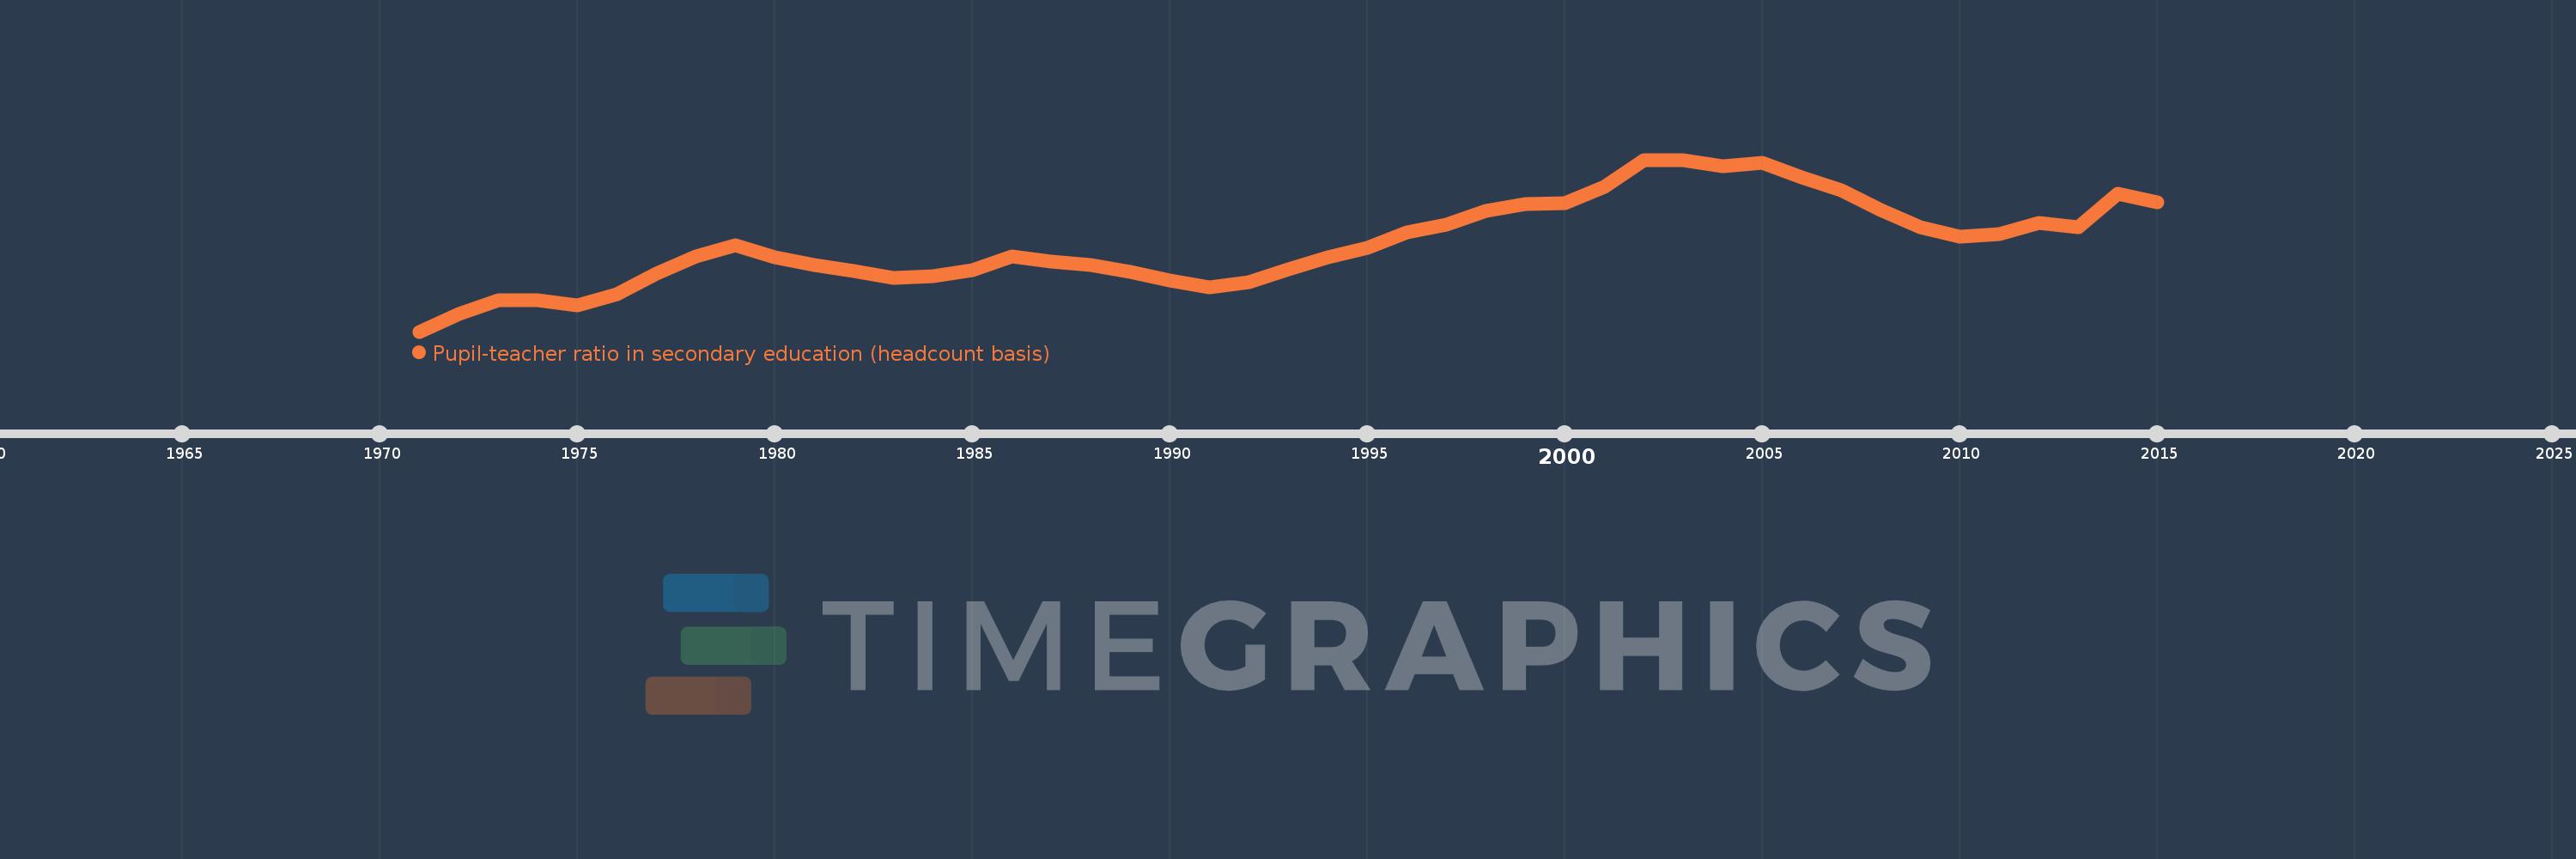
Pupil-teacher ratio in secondary education (headcount basis)
2015,2014,2013,2012,2011,2010,2009,2008,2007,2006,2005,2004,2003,2002,2001,2000,1999,1998,1997,1996,1995,1994,1993,1992,1991,1990,1989,1988,1987,1986,1985,1984,1983,1982,1981,1980,1979,1978,1977,1976,1975,1974,1973,1972,1971
This statistics in other country:
AfghanistanAlbaniaAlgeriaAndorraAngolaAntigua and BarbudaArab WorldArgentinaArmeniaArubaAustriaBahamas, TheBahrainBangladeshBarbadosBelarusBelgiumBelizeBeninBermudaBhutanBoliviaBosnia and HerzegovinaBotswanaBrazilBritish Virgin IslandsBrunei DarussalamBulgariaBurkina FasoBurundiCabo VerdeCambodiaCameroonCanadaCaribbean small statesCayman IslandsCentral African RepublicCentral Europe and the BalticsChadChileChinaColombiaComorosCongo, Dem. Rep.Congo, Rep.Costa RicaCote d'IvoireCroatiaCubaCyprusCzech RepublicDenmarkDjiboutiDominicaDominican RepublicEarly-demographic dividendEast Asia & PacificEast Asia & Pacific (excluding high income)East Asia & Pacific (IDA & IBRD countries)EcuadorEgypt, Arab Rep.El SalvadorEquatorial GuineaEritreaEstoniaEthiopiaEuro areaEurope & Central AsiaEurope & Central Asia (excluding high income)Europe & Central Asia (IDA & IBRD countries)European UnionFijiFinlandFragile and conflict affected situationsFranceGabonGambia, TheGeorgiaGermanyGhanaGibraltarGreeceGrenadaGuatemalaGuineaGuinea-BissauGuyanaHaitiHeavily indebted poor countries (HIPC)High incomeHondurasHong Kong SAR, ChinaHungaryIBRD onlyIcelandIDA & IBRD totalIDA blendIDA onlyIDA totalIndiaIndonesiaIran, Islamic Rep.IraqIrelandIsraelItalyJamaicaJapanJordanKazakhstanKenyaKiribatiKorea, Dem. People’s Rep.Korea, Rep.KuwaitKyrgyz RepublicLao PDRLate-demographic dividendLatin America & Caribbean Latin America & Caribbean (excluding high income)Latin America & the Caribbean (IDA & IBRD countries)LatviaLeast developed countries: UN classificationLebanonLesothoLiberiaLibyaLiechtensteinLithuaniaLow & middle incomeLow incomeLower middle incomeLuxembourgMacao SAR, ChinaMacedonia, FYRMadagascarMalawiMalaysiaMaldivesMaliMaltaMarshall IslandsMauritaniaMauritiusMexicoMiddle East & North AfricaMiddle East & North Africa (excluding high income)Middle East & North Africa (IDA & IBRD countries)Middle incomeMoldovaMonacoMongoliaMoroccoMozambiqueMyanmarNamibiaNauruNepalNetherlandsNew ZealandNicaraguaNigerNigeriaNorth AmericaNorwayOECD membersOmanOther small statesPacific island small statesPakistanPalauPanamaPapua New GuineaParaguayPeruPhilippinesPolandPortugalPost-demographic dividendPre-demographic dividendPuerto RicoQatarRomaniaRussian FederationRwandaSamoaSan MarinoSao Tome and PrincipeSaudi ArabiaSenegalSerbiaSeychellesSierra LeoneSingaporeSint Maarten (Dutch part)Slovak RepublicSloveniaSmall statesSolomon IslandsSomaliaSouth AfricaSouth AsiaSouth Asia (IDA & IBRD)SpainSri LankaSt. Kitts and NevisSt. LuciaSt. Vincent and the GrenadinesSub-Saharan Africa Sub-Saharan Africa (excluding high income)Sub-Saharan Africa (IDA & IBRD countries)SudanSurinameSwazilandSwedenSwitzerlandSyrian Arab RepublicTajikistanTanzaniaThailandTimor-LesteTogoTongaTrinidad and TobagoTunisiaTurkeyTurks and Caicos IslandsUgandaUkraineUnited Arab EmiratesUnited KingdomUnited StatesUpper middle incomeUruguayUzbekistanVanuatuVenezuela, RBVietnamWest Bank and GazaWorldYemen, Rep.ZambiaZimbabwe Timeline:
This timeline shows a graph from 1971 to 2015 of Low & middle income. No data until 1970. Number of actual observations by date: 45.
Source name:
World Development Indicators
Source organization:
UNESCO Institute for Statistics
Categories, topics:
Education
Last updated:
apr 23, 2017
Indicators value changes by year
Minimum:
16.053
jan 1, 1971
Maximum:
20.024
jan 1, 2002
At the date of observation
Value
Absolute change
Change from previous value
jan 1, 1971
16.053
+16.053
0.0%
jan 1, 1972
16.453
+0.4
2.49%
jan 1, 1973
16.781
+0.328
1.99%
jan 1, 1974
16.772
-0.009
-0.05%
jan 1, 1975
16.664
-0.108
-0.64%
jan 1, 1976
16.926
+0.263
1.58%
jan 1, 1977
17.398
+0.472
2.79%
jan 1, 1978
17.797
+0.398
2.29%
jan 1, 1979
18.04
+0.243
1.37%
jan 1, 1980
17.78
-0.26
-1.44%
jan 1, 1981
17.599
-0.181
-1.02%
jan 1, 1982
17.456
-0.143
-0.81%
jan 1, 1983
17.296
-0.16
-0.92%
jan 1, 1984
17.337
+0.041
0.24%
jan 1, 1985
17.469
+0.132
0.76%
jan 1, 1986
17.796
+0.327
1.87%
jan 1, 1987
17.68
-0.116
-0.65%
jan 1, 1988
17.598
-0.082
-0.47%
jan 1, 1989
17.438
-0.16
-0.91%
jan 1, 1990
17.231
-0.207
-1.19%
jan 1, 1991
17.07
-0.161
-0.93%
jan 1, 1992
17.196
+0.126
0.74%
jan 1, 1993
17.486
+0.289
1.68%
jan 1, 1994
17.772
+0.286
1.64%
jan 1, 1995
17.99
+0.218
1.22%
jan 1, 1996
18.339
+0.35
1.94%
jan 1, 1997
18.531
+0.192
1.05%
jan 1, 1998
18.836
+0.305
1.65%
jan 1, 1999
19.007
+0.17
0.9%
jan 1, 2000
19.029
+0.022
0.12%
jan 1, 2001
19.394
+0.365
1.92%
jan 1, 2002
20.024
+0.63
3.25%
jan 1, 2003
20.009
-0.016
-0.08%
jan 1, 2004
19.878
-0.13
-0.65%
jan 1, 2005
19.955
+0.077
0.39%
jan 1, 2006
19.614
-0.341
-1.71%
jan 1, 2007
19.312
-0.302
-1.54%
jan 1, 2008
18.869
-0.443
-2.3%
jan 1, 2009
18.461
-0.407
-2.16%
jan 1, 2010
18.245
-0.216
-1.17%
jan 1, 2011
18.315
+0.07
0.38%
jan 1, 2012
18.557
+0.242
1.32%
jan 1, 2013
18.475
-0.082
-0.44%
jan 1, 2014
19.244
+0.769
4.16%
jan 1, 2015
19.043
-0.201
-1.04%
Ranking of countries by current statistics by years


Comments: