29
/
en
AIzaSyAYiBZKx7MnpbEhh9jyipgxe19OcubqV5w
April 1, 2024
34579
Fragile and conflict affected situations
FCS
false
2
1
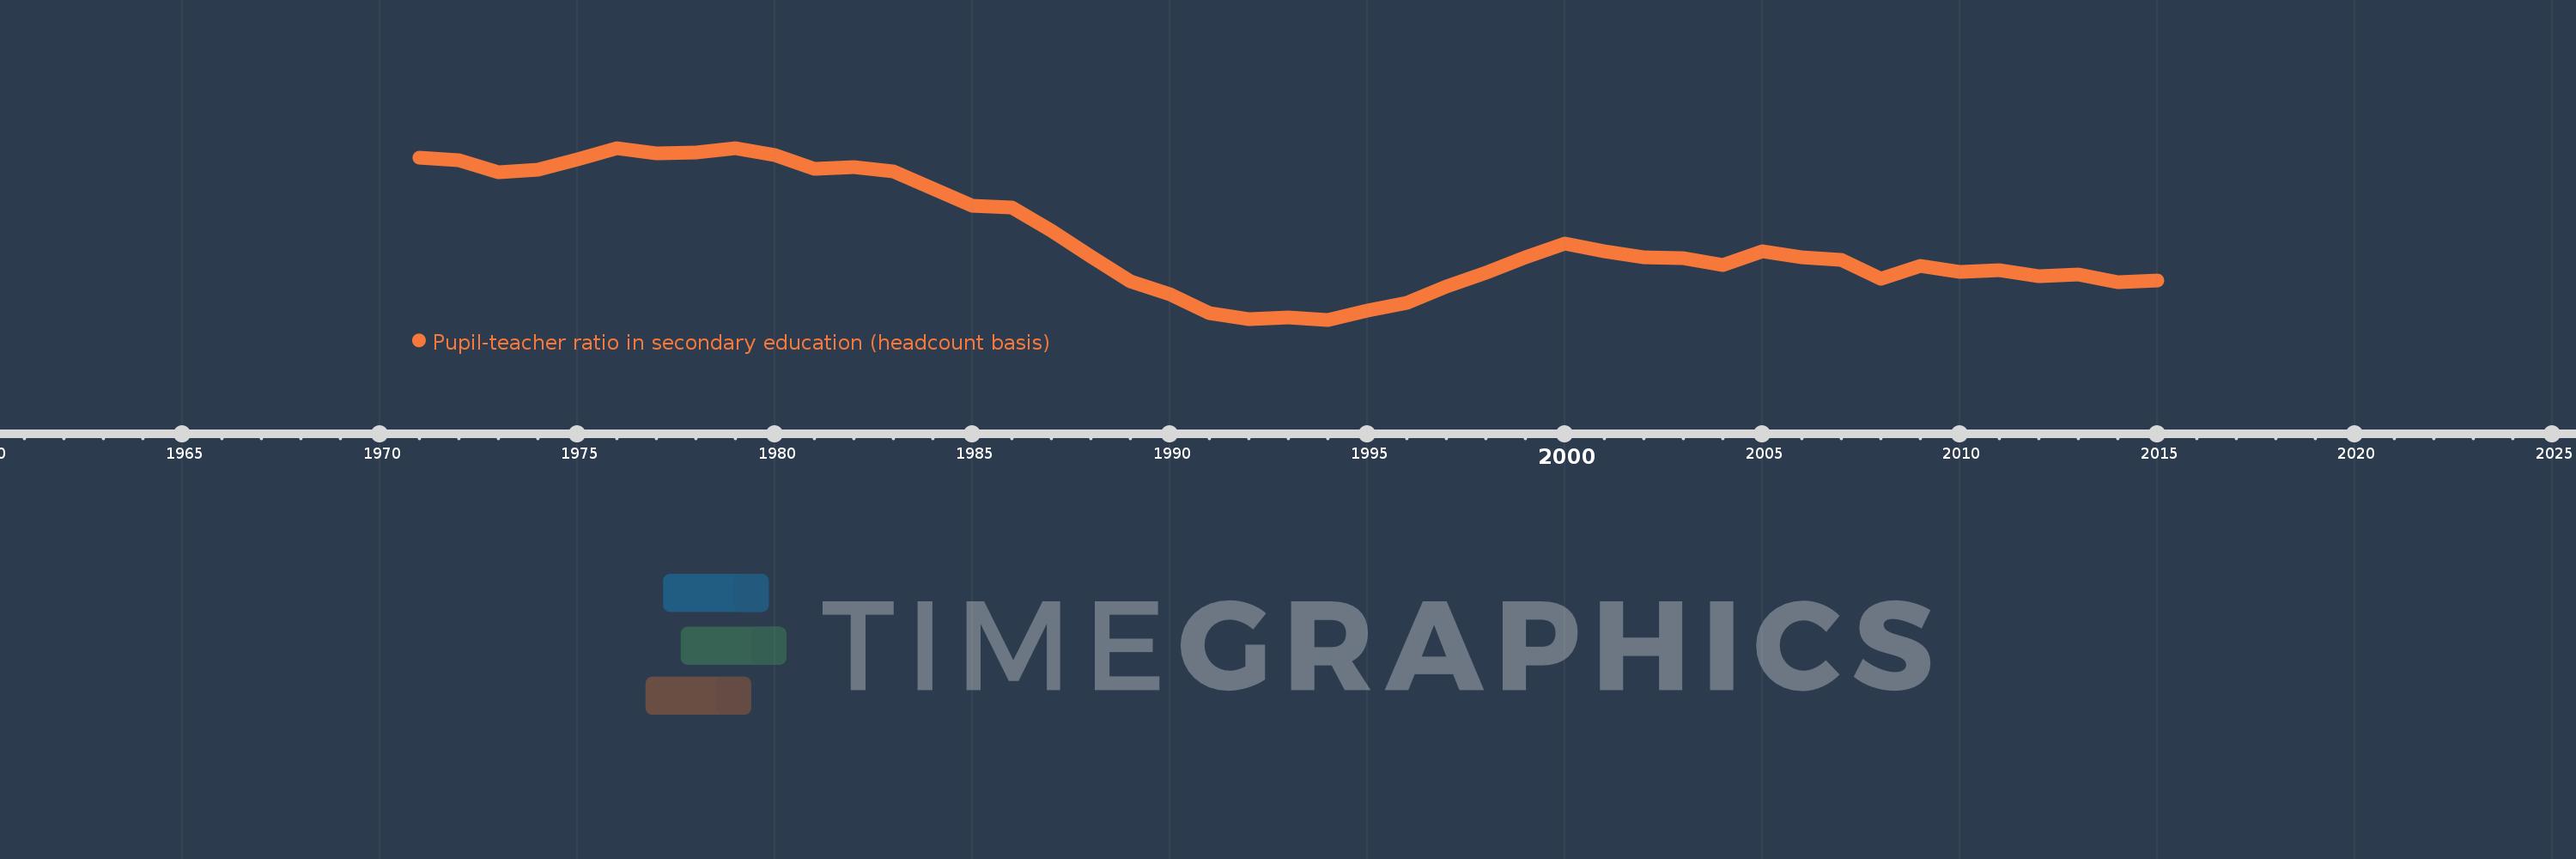
Pupil-teacher ratio in secondary education (headcount basis)
2015,2014,2013,2012,2011,2010,2009,2008,2007,2006,2005,2004,2003,2002,2001,2000,1999,1998,1997,1996,1995,1994,1993,1992,1991,1990,1989,1988,1987,1986,1985,1984,1983,1982,1981,1980,1979,1978,1977,1976,1975,1974,1973,1972,1971
This statistics in other country:
AfghanistanAlbaniaAlgeriaAndorraAngolaAntigua and BarbudaArab WorldArgentinaArmeniaArubaAustriaBahamas, TheBahrainBangladeshBarbadosBelarusBelgiumBelizeBeninBermudaBhutanBoliviaBosnia and HerzegovinaBotswanaBrazilBritish Virgin IslandsBrunei DarussalamBulgariaBurkina FasoBurundiCabo VerdeCambodiaCameroonCanadaCaribbean small statesCayman IslandsCentral African RepublicCentral Europe and the BalticsChadChileChinaColombiaComorosCongo, Dem. Rep.Congo, Rep.Costa RicaCote d'IvoireCroatiaCubaCyprusCzech RepublicDenmarkDjiboutiDominicaDominican RepublicEarly-demographic dividendEast Asia & PacificEast Asia & Pacific (excluding high income)East Asia & Pacific (IDA & IBRD countries)EcuadorEgypt, Arab Rep.El SalvadorEquatorial GuineaEritreaEstoniaEthiopiaEuro areaEurope & Central AsiaEurope & Central Asia (excluding high income)Europe & Central Asia (IDA & IBRD countries)European UnionFijiFinlandFragile and conflict affected situationsFranceGabonGambia, TheGeorgiaGermanyGhanaGibraltarGreeceGrenadaGuatemalaGuineaGuinea-BissauGuyanaHaitiHeavily indebted poor countries (HIPC)High incomeHondurasHong Kong SAR, ChinaHungaryIBRD onlyIcelandIDA & IBRD totalIDA blendIDA onlyIDA totalIndiaIndonesiaIran, Islamic Rep.IraqIrelandIsraelItalyJamaicaJapanJordanKazakhstanKenyaKiribatiKorea, Dem. People’s Rep.Korea, Rep.KuwaitKyrgyz RepublicLao PDRLate-demographic dividendLatin America & Caribbean Latin America & Caribbean (excluding high income)Latin America & the Caribbean (IDA & IBRD countries)LatviaLeast developed countries: UN classificationLebanonLesothoLiberiaLibyaLiechtensteinLithuaniaLow & middle incomeLow incomeLower middle incomeLuxembourgMacao SAR, ChinaMacedonia, FYRMadagascarMalawiMalaysiaMaldivesMaliMaltaMarshall IslandsMauritaniaMauritiusMexicoMiddle East & North AfricaMiddle East & North Africa (excluding high income)Middle East & North Africa (IDA & IBRD countries)Middle incomeMoldovaMonacoMongoliaMoroccoMozambiqueMyanmarNamibiaNauruNepalNetherlandsNew ZealandNicaraguaNigerNigeriaNorth AmericaNorwayOECD membersOmanOther small statesPacific island small statesPakistanPalauPanamaPapua New GuineaParaguayPeruPhilippinesPolandPortugalPost-demographic dividendPre-demographic dividendPuerto RicoQatarRomaniaRussian FederationRwandaSamoaSan MarinoSao Tome and PrincipeSaudi ArabiaSenegalSerbiaSeychellesSierra LeoneSingaporeSint Maarten (Dutch part)Slovak RepublicSloveniaSmall statesSolomon IslandsSomaliaSouth AfricaSouth AsiaSouth Asia (IDA & IBRD)SpainSri LankaSt. Kitts and NevisSt. LuciaSt. Vincent and the GrenadinesSub-Saharan Africa Sub-Saharan Africa (excluding high income)Sub-Saharan Africa (IDA & IBRD countries)SudanSurinameSwazilandSwedenSwitzerlandSyrian Arab RepublicTajikistanTanzaniaThailandTimor-LesteTogoTongaTrinidad and TobagoTunisiaTurkeyTurks and Caicos IslandsUgandaUkraineUnited Arab EmiratesUnited KingdomUnited StatesUpper middle incomeUruguayUzbekistanVanuatuVenezuela, RBVietnamWest Bank and GazaWorldYemen, Rep.ZambiaZimbabwe Timeline:
This timeline shows a graph from 1971 to 2015 of Fragile and conflict affected situations. No data until 1970. Number of actual observations by date: 45.
Source name:
World Development Indicators
Source organization:
UNESCO Institute for Statistics
Categories, topics:
Education
Last updated:
apr 23, 2017
Indicators value changes by year
Minimum:
18.905
jan 1, 1994
Maximum:
24.367
jan 1, 1979
At the date of observation
Value
Absolute change
Change from previous value
jan 1, 1971
24.054
+24.054
0.0%
jan 1, 1972
23.966
-0.088
-0.37%
jan 1, 1973
23.593
-0.373
-1.55%
jan 1, 1974
23.678
+0.085
0.36%
jan 1, 1975
23.992
+0.314
1.32%
jan 1, 1976
24.351
+0.359
1.5%
jan 1, 1977
24.206
-0.145
-0.59%
jan 1, 1978
24.231
+0.024
0.1%
jan 1, 1979
24.367
+0.137
0.56%
jan 1, 1980
24.127
-0.24
-0.98%
jan 1, 1981
23.703
-0.424
-1.76%
jan 1, 1982
23.759
+0.056
0.24%
jan 1, 1983
23.634
-0.124
-0.52%
jan 1, 1984
23.065
-0.569
-2.41%
jan 1, 1985
22.539
-0.526
-2.28%
jan 1, 1986
22.472
-0.067
-0.3%
jan 1, 1987
21.74
-0.731
-3.25%
jan 1, 1988
20.914
-0.827
-3.8%
jan 1, 1989
20.113
-0.8
-3.83%
jan 1, 1990
19.709
-0.404
-2.01%
jan 1, 1991
19.106
-0.604
-3.06%
jan 1, 1992
18.935
-0.171
-0.9%
jan 1, 1993
18.991
+0.057
0.3%
jan 1, 1994
18.905
-0.086
-0.45%
jan 1, 1995
19.185
+0.279
1.48%
jan 1, 1996
19.453
+0.269
1.4%
jan 1, 1997
19.949
+0.496
2.55%
jan 1, 1998
20.406
+0.457
2.29%
jan 1, 1999
20.898
+0.492
2.41%
jan 1, 2000
21.324
+0.425
2.04%
jan 1, 2001
21.076
-0.247
-1.16%
jan 1, 2002
20.888
-0.189
-0.89%
jan 1, 2003
20.868
-0.02
-0.1%
jan 1, 2004
20.64
-0.228
-1.09%
jan 1, 2005
21.089
+0.449
2.18%
jan 1, 2006
20.894
-0.195
-0.93%
jan 1, 2007
20.813
-0.081
-0.39%
jan 1, 2008
20.203
-0.61
-2.93%
jan 1, 2009
20.609
+0.406
2.01%
jan 1, 2010
20.419
-0.19
-0.92%
jan 1, 2011
20.479
+0.06
0.29%
jan 1, 2012
20.294
-0.185
-0.91%
jan 1, 2013
20.333
+0.039
0.19%
jan 1, 2014
20.107
-0.225
-1.11%
jan 1, 2015
20.155
+0.048
0.24%
Ranking of countries by current statistics by years


Comments: