29
/
en
AIzaSyAYiBZKx7MnpbEhh9jyipgxe19OcubqV5w
April 1, 2024
224244
Philippines
PHL
true
2
1
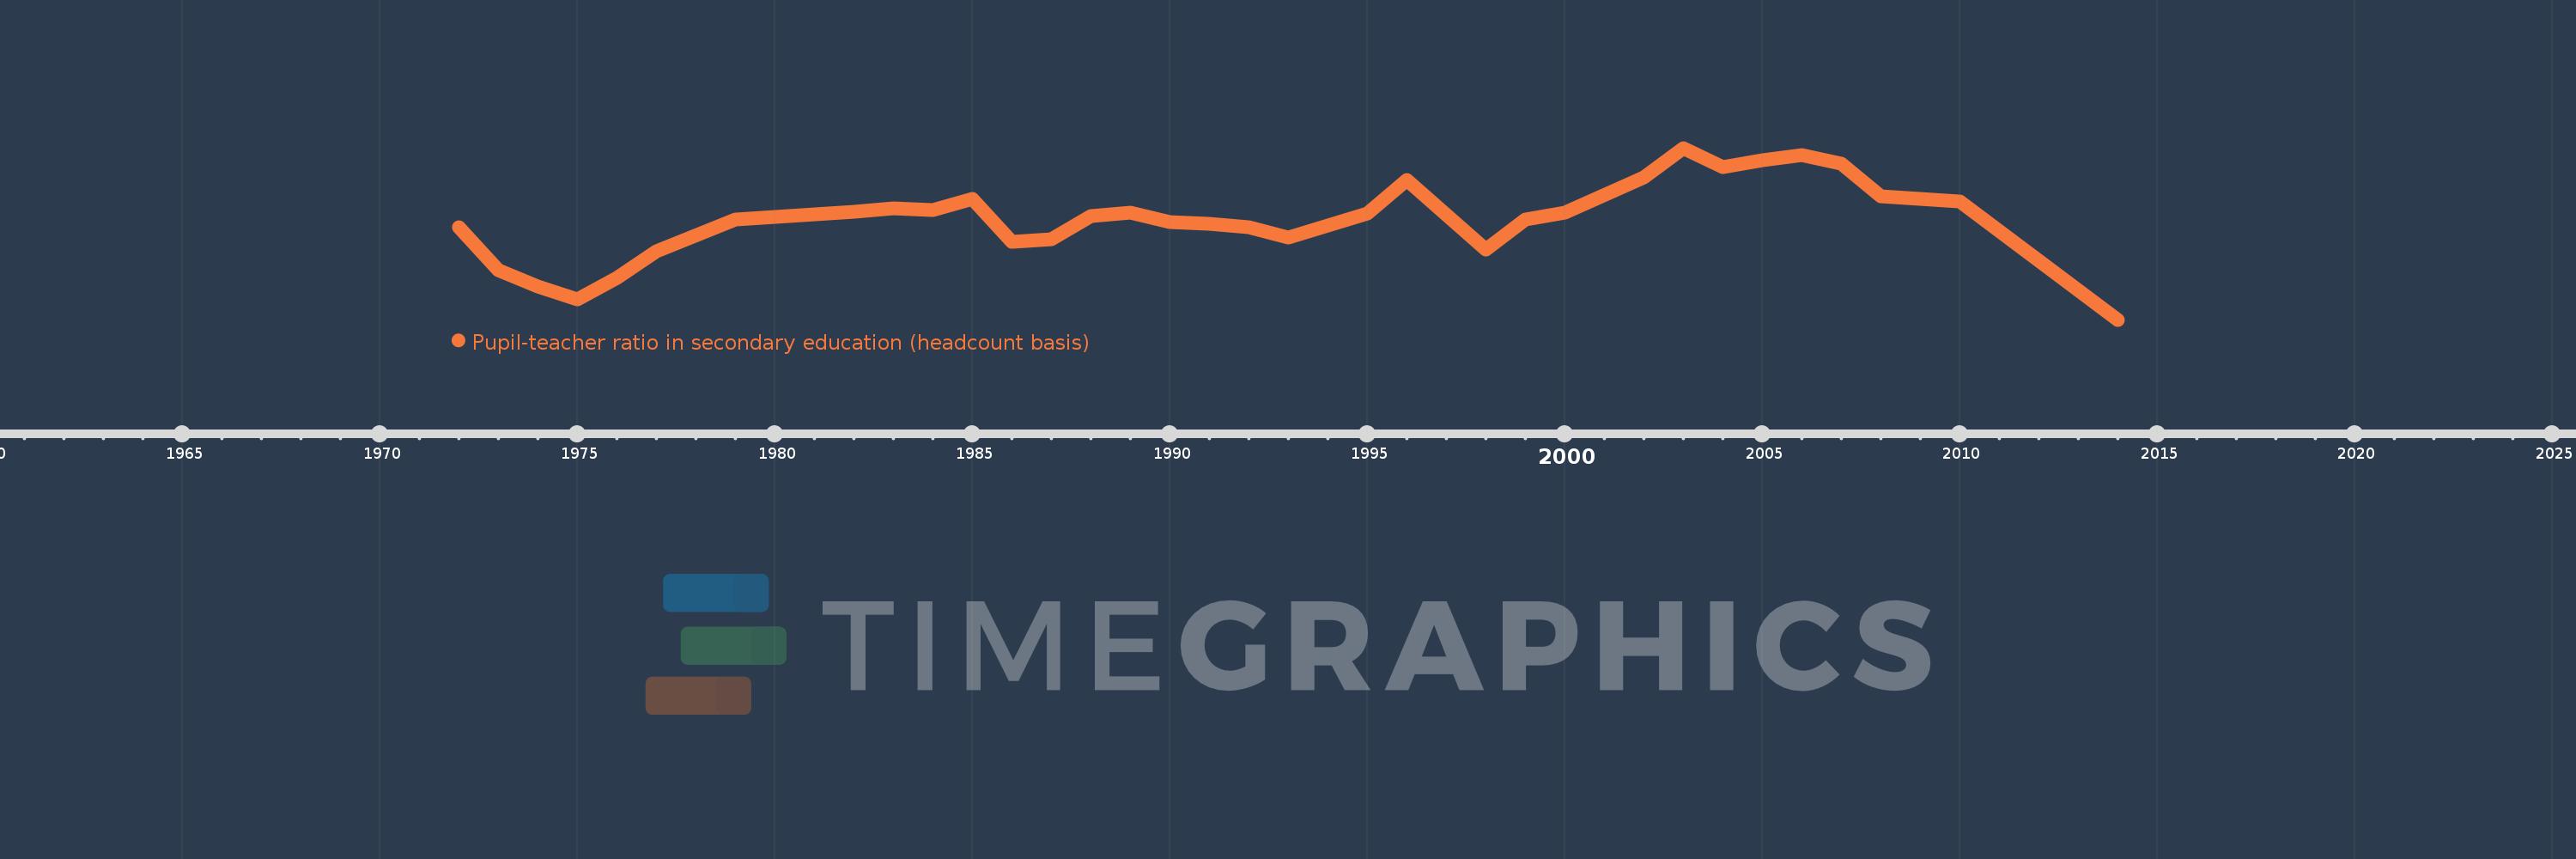
Pupil-teacher ratio in secondary education (headcount basis)
2014,2010,2008,2007,2006,2005,2004,2003,2002,2000,1999,1998,1996,1995,1993,1992,1991,1990,1989,1988,1987,1986,1985,1984,1983,1982,1979,1977,1976,1975,1974,1973,1972
This statistics in other country:
AfghanistanAlbaniaAlgeriaAndorraAngolaAntigua and BarbudaArab WorldArgentinaArmeniaArubaAustriaBahamas, TheBahrainBangladeshBarbadosBelarusBelgiumBelizeBeninBermudaBhutanBoliviaBosnia and HerzegovinaBotswanaBrazilBritish Virgin IslandsBrunei DarussalamBulgariaBurkina FasoBurundiCabo VerdeCambodiaCameroonCanadaCaribbean small statesCayman IslandsCentral African RepublicCentral Europe and the BalticsChadChileChinaColombiaComorosCongo, Dem. Rep.Congo, Rep.Costa RicaCote d'IvoireCroatiaCubaCyprusCzech RepublicDenmarkDjiboutiDominicaDominican RepublicEarly-demographic dividendEast Asia & PacificEast Asia & Pacific (excluding high income)East Asia & Pacific (IDA & IBRD countries)EcuadorEgypt, Arab Rep.El SalvadorEquatorial GuineaEritreaEstoniaEthiopiaEuro areaEurope & Central AsiaEurope & Central Asia (excluding high income)Europe & Central Asia (IDA & IBRD countries)European UnionFijiFinlandFragile and conflict affected situationsFranceGabonGambia, TheGeorgiaGermanyGhanaGibraltarGreeceGrenadaGuatemalaGuineaGuinea-BissauGuyanaHaitiHeavily indebted poor countries (HIPC)High incomeHondurasHong Kong SAR, ChinaHungaryIBRD onlyIcelandIDA & IBRD totalIDA blendIDA onlyIDA totalIndiaIndonesiaIran, Islamic Rep.IraqIrelandIsraelItalyJamaicaJapanJordanKazakhstanKenyaKiribatiKorea, Dem. People’s Rep.Korea, Rep.KuwaitKyrgyz RepublicLao PDRLate-demographic dividendLatin America & Caribbean Latin America & Caribbean (excluding high income)Latin America & the Caribbean (IDA & IBRD countries)LatviaLeast developed countries: UN classificationLebanonLesothoLiberiaLibyaLiechtensteinLithuaniaLow & middle incomeLow incomeLower middle incomeLuxembourgMacao SAR, ChinaMacedonia, FYRMadagascarMalawiMalaysiaMaldivesMaliMaltaMarshall IslandsMauritaniaMauritiusMexicoMiddle East & North AfricaMiddle East & North Africa (excluding high income)Middle East & North Africa (IDA & IBRD countries)Middle incomeMoldovaMonacoMongoliaMoroccoMozambiqueMyanmarNamibiaNauruNepalNetherlandsNew ZealandNicaraguaNigerNigeriaNorth AmericaNorwayOECD membersOmanOther small statesPacific island small statesPakistanPalauPanamaPapua New GuineaParaguayPeruPhilippinesPolandPortugalPost-demographic dividendPre-demographic dividendPuerto RicoQatarRomaniaRussian FederationRwandaSamoaSan MarinoSao Tome and PrincipeSaudi ArabiaSenegalSerbiaSeychellesSierra LeoneSingaporeSint Maarten (Dutch part)Slovak RepublicSloveniaSmall statesSolomon IslandsSomaliaSouth AfricaSouth AsiaSouth Asia (IDA & IBRD)SpainSri LankaSt. Kitts and NevisSt. LuciaSt. Vincent and the GrenadinesSub-Saharan Africa Sub-Saharan Africa (excluding high income)Sub-Saharan Africa (IDA & IBRD countries)SudanSurinameSwazilandSwedenSwitzerlandSyrian Arab RepublicTajikistanTanzaniaThailandTimor-LesteTogoTongaTrinidad and TobagoTunisiaTurkeyTurks and Caicos IslandsUgandaUkraineUnited Arab EmiratesUnited KingdomUnited StatesUpper middle incomeUruguayUzbekistanVanuatuVenezuela, RBVietnamWest Bank and GazaWorldYemen, Rep.ZambiaZimbabwe Timeline:
This timeline shows a graph from 1972 to 2014 of Philippines. No data until 1971. Number of actual observations by date: 33.
Source name:
World Development Indicators
Source organization:
UNESCO Institute for Statistics
Categories, topics:
Education
Last updated:
apr 23, 2017
Indicators value changes by year
Minimum:
26.991
jan 1, 2014
Maximum:
38.331
jan 1, 2003
At the date of observation
Value
Absolute change
Change from previous value
jan 1, 1972
33.078
+33.078
0.0%
jan 1, 1973
30.277
-2.801
-8.47%
jan 1, 1974
29.159
-1.118
-3.69%
jan 1, 1975
28.309
-0.85
-2.92%
jan 1, 1976
29.771
+1.462
5.17%
jan 1, 1977
31.489
+1.718
5.77%
jan 1, 1979
33.625
+2.136
6.78%
jan 1, 1982
34.14
+0.515
1.53%
jan 1, 1983
34.35
+0.21
0.61%
jan 1, 1984
34.256
-0.094
-0.27%
jan 1, 1985
34.983
+0.728
2.12%
jan 1, 1986
32.113
-2.87
-8.2%
jan 1, 1987
32.313
+0.2
0.62%
jan 1, 1988
33.843
+1.53
4.73%
jan 1, 1989
34.055
+0.212
0.63%
jan 1, 1990
33.446
-0.609
-1.79%
jan 1, 1991
33.346
-0.101
-0.3%
jan 1, 1992
33.093
-0.253
-0.76%
jan 1, 1993
32.445
-0.648
-1.96%
jan 1, 1995
34.026
+1.581
4.87%
jan 1, 1996
36.203
+2.177
6.4%
jan 1, 1998
31.597
-4.606
-12.72%
jan 1, 1999
33.622
+2.025
6.41%
jan 1, 2000
34.068
+0.446
1.33%
jan 1, 2002
36.387
+2.318
6.81%
jan 1, 2003
38.331
+1.944
5.34%
jan 1, 2004
37.087
-1.244
-3.25%
jan 1, 2005
37.539
+0.453
1.22%
jan 1, 2006
37.869
+0.33
0.88%
jan 1, 2007
37.271
-0.598
-1.58%
jan 1, 2008
35.134
-2.137
-5.73%
jan 1, 2010
34.814
-0.319
-0.91%
jan 1, 2014
26.991
-7.824
-22.47%
Ranking of countries by current statistics by years


Comments: