29
/
en
AIzaSyAYiBZKx7MnpbEhh9jyipgxe19OcubqV5w
April 1, 2024
55113
Post-demographic dividend
PST
false
2
1
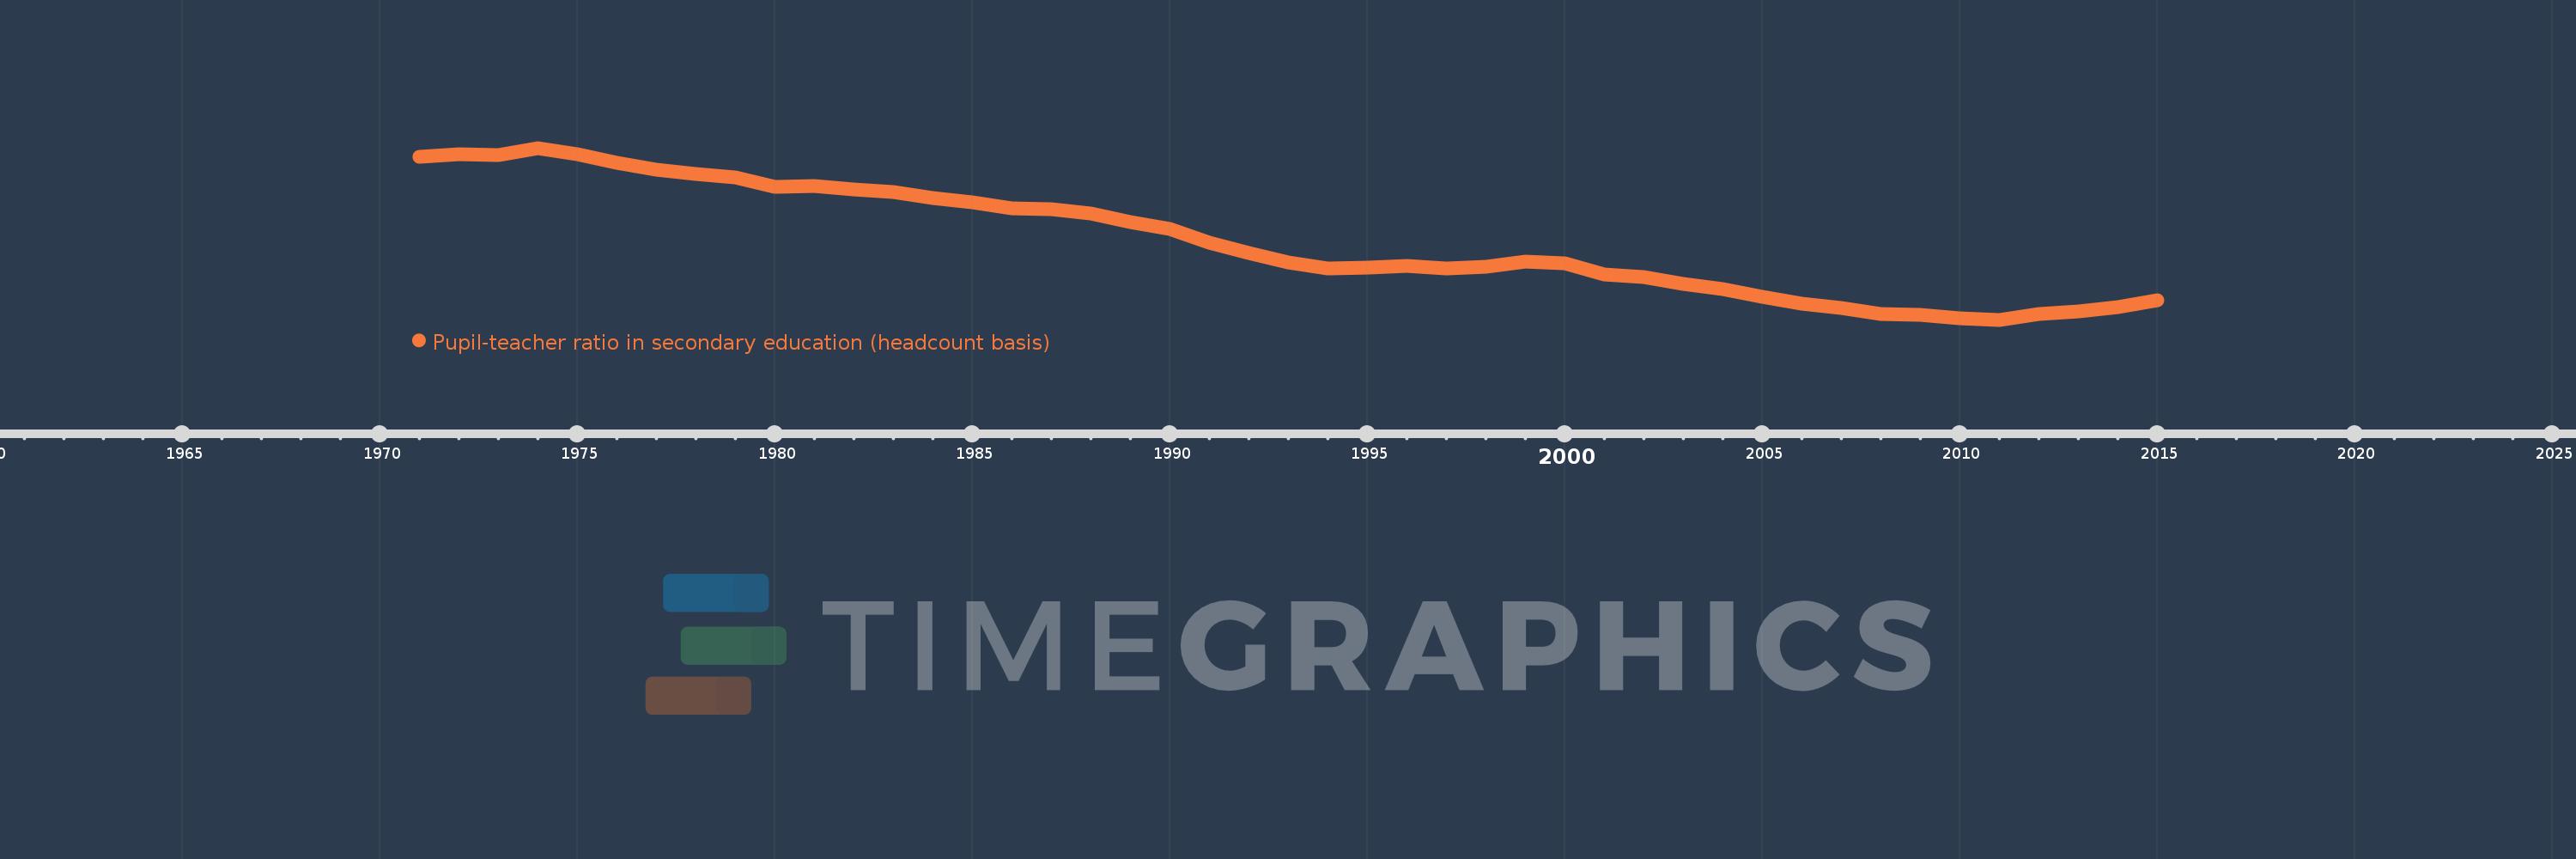
Pupil-teacher ratio in secondary education (headcount basis)
2015,2014,2013,2012,2011,2010,2009,2008,2007,2006,2005,2004,2003,2002,2001,2000,1999,1998,1997,1996,1995,1994,1993,1992,1991,1990,1989,1988,1987,1986,1985,1984,1983,1982,1981,1980,1979,1978,1977,1976,1975,1974,1973,1972,1971
This statistics in other country:
AfghanistanAlbaniaAlgeriaAndorraAngolaAntigua and BarbudaArab WorldArgentinaArmeniaArubaAustriaBahamas, TheBahrainBangladeshBarbadosBelarusBelgiumBelizeBeninBermudaBhutanBoliviaBosnia and HerzegovinaBotswanaBrazilBritish Virgin IslandsBrunei DarussalamBulgariaBurkina FasoBurundiCabo VerdeCambodiaCameroonCanadaCaribbean small statesCayman IslandsCentral African RepublicCentral Europe and the BalticsChadChileChinaColombiaComorosCongo, Dem. Rep.Congo, Rep.Costa RicaCote d'IvoireCroatiaCubaCyprusCzech RepublicDenmarkDjiboutiDominicaDominican RepublicEarly-demographic dividendEast Asia & PacificEast Asia & Pacific (excluding high income)East Asia & Pacific (IDA & IBRD countries)EcuadorEgypt, Arab Rep.El SalvadorEquatorial GuineaEritreaEstoniaEthiopiaEuro areaEurope & Central AsiaEurope & Central Asia (excluding high income)Europe & Central Asia (IDA & IBRD countries)European UnionFijiFinlandFragile and conflict affected situationsFranceGabonGambia, TheGeorgiaGermanyGhanaGibraltarGreeceGrenadaGuatemalaGuineaGuinea-BissauGuyanaHaitiHeavily indebted poor countries (HIPC)High incomeHondurasHong Kong SAR, ChinaHungaryIBRD onlyIcelandIDA & IBRD totalIDA blendIDA onlyIDA totalIndiaIndonesiaIran, Islamic Rep.IraqIrelandIsraelItalyJamaicaJapanJordanKazakhstanKenyaKiribatiKorea, Dem. People’s Rep.Korea, Rep.KuwaitKyrgyz RepublicLao PDRLate-demographic dividendLatin America & Caribbean Latin America & Caribbean (excluding high income)Latin America & the Caribbean (IDA & IBRD countries)LatviaLeast developed countries: UN classificationLebanonLesothoLiberiaLibyaLiechtensteinLithuaniaLow & middle incomeLow incomeLower middle incomeLuxembourgMacao SAR, ChinaMacedonia, FYRMadagascarMalawiMalaysiaMaldivesMaliMaltaMarshall IslandsMauritaniaMauritiusMexicoMiddle East & North AfricaMiddle East & North Africa (excluding high income)Middle East & North Africa (IDA & IBRD countries)Middle incomeMoldovaMonacoMongoliaMoroccoMozambiqueMyanmarNamibiaNauruNepalNetherlandsNew ZealandNicaraguaNigerNigeriaNorth AmericaNorwayOECD membersOmanOther small statesPacific island small statesPakistanPalauPanamaPapua New GuineaParaguayPeruPhilippinesPolandPortugalPost-demographic dividendPre-demographic dividendPuerto RicoQatarRomaniaRussian FederationRwandaSamoaSan MarinoSao Tome and PrincipeSaudi ArabiaSenegalSerbiaSeychellesSierra LeoneSingaporeSint Maarten (Dutch part)Slovak RepublicSloveniaSmall statesSolomon IslandsSomaliaSouth AfricaSouth AsiaSouth Asia (IDA & IBRD)SpainSri LankaSt. Kitts and NevisSt. LuciaSt. Vincent and the GrenadinesSub-Saharan Africa Sub-Saharan Africa (excluding high income)Sub-Saharan Africa (IDA & IBRD countries)SudanSurinameSwazilandSwedenSwitzerlandSyrian Arab RepublicTajikistanTanzaniaThailandTimor-LesteTogoTongaTrinidad and TobagoTunisiaTurkeyTurks and Caicos IslandsUgandaUkraineUnited Arab EmiratesUnited KingdomUnited StatesUpper middle incomeUruguayUzbekistanVanuatuVenezuela, RBVietnamWest Bank and GazaWorldYemen, Rep.ZambiaZimbabwe Timeline:
This timeline shows a graph from 1971 to 2015 of Post-demographic dividend. No data until 1970. Number of actual observations by date: 45.
Source name:
World Development Indicators
Source organization:
UNESCO Institute for Statistics
Categories, topics:
Education
Last updated:
apr 23, 2017
Indicators value changes by year
Minimum:
12.541
jan 1, 2011
Maximum:
16.335
jan 1, 1974
At the date of observation
Value
Absolute change
Change from previous value
jan 1, 1971
16.132
+16.132
0.0%
jan 1, 1972
16.19
+0.058
0.36%
jan 1, 1973
16.169
-0.021
-0.13%
jan 1, 1974
16.335
+0.167
1.03%
jan 1, 1975
16.2
-0.135
-0.83%
jan 1, 1976
16.015
-0.185
-1.14%
jan 1, 1977
15.862
-0.153
-0.95%
jan 1, 1978
15.767
-0.095
-0.6%
jan 1, 1979
15.685
-0.082
-0.52%
jan 1, 1980
15.483
-0.202
-1.29%
jan 1, 1981
15.496
+0.013
0.09%
jan 1, 1982
15.415
-0.081
-0.52%
jan 1, 1983
15.353
-0.062
-0.4%
jan 1, 1984
15.224
-0.129
-0.84%
jan 1, 1985
15.143
-0.082
-0.54%
jan 1, 1986
14.992
-0.15
-0.99%
jan 1, 1987
14.985
-0.008
-0.05%
jan 1, 1988
14.882
-0.103
-0.69%
jan 1, 1989
14.692
-0.19
-1.28%
jan 1, 1990
14.546
-0.146
-0.99%
jan 1, 1991
14.245
-0.301
-2.07%
jan 1, 1992
14.011
-0.234
-1.64%
jan 1, 1993
13.815
-0.196
-1.4%
jan 1, 1994
13.676
-0.139
-1.01%
jan 1, 1995
13.691
+0.014
0.1%
jan 1, 1996
13.727
+0.036
0.26%
jan 1, 1997
13.681
-0.046
-0.33%
jan 1, 1998
13.705
+0.025
0.18%
jan 1, 1999
13.82
+0.115
0.84%
jan 1, 2000
13.78
-0.04
-0.29%
jan 1, 2001
13.532
-0.248
-1.8%
jan 1, 2002
13.479
-0.052
-0.39%
jan 1, 2003
13.331
-0.148
-1.1%
jan 1, 2004
13.225
-0.106
-0.79%
jan 1, 2005
13.047
-0.178
-1.35%
jan 1, 2006
12.896
-0.151
-1.16%
jan 1, 2007
12.802
-0.094
-0.73%
jan 1, 2008
12.671
-0.131
-1.03%
jan 1, 2009
12.652
-0.019
-0.15%
jan 1, 2010
12.579
-0.072
-0.57%
jan 1, 2011
12.541
-0.038
-0.3%
jan 1, 2012
12.675
+0.134
1.07%
jan 1, 2013
12.73
+0.055
0.44%
jan 1, 2014
12.812
+0.082
0.64%
jan 1, 2015
12.966
+0.154
1.2%
Ranking of countries by current statistics by years


Comments: