30
/
AIzaSyAYiBZKx7MnpbEhh9jyipgxe19OcubqV5w
April 1, 2024
118377
Czech Republic
CZE
true
2
1
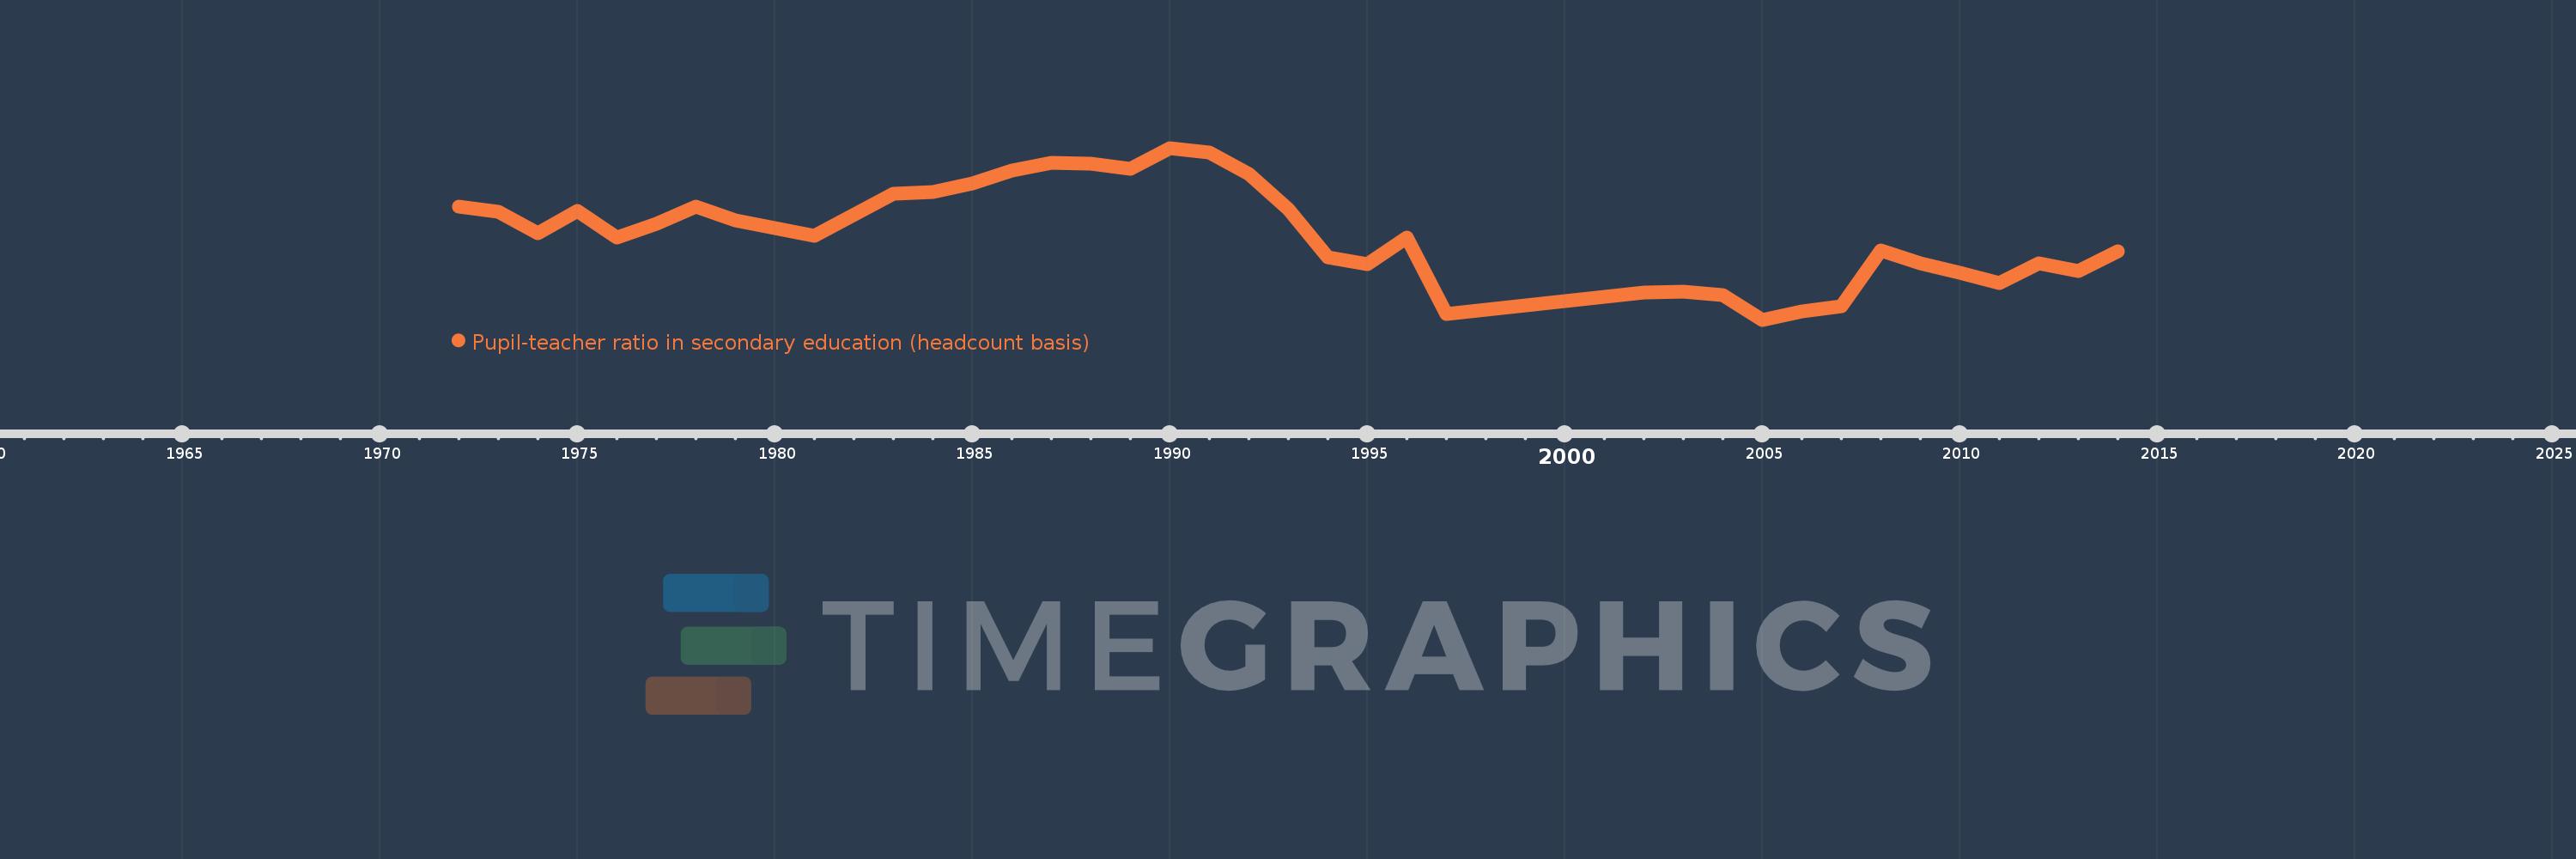
Pupil-teacher ratio in secondary education (headcount basis)
2014,2013,2012,2011,2010,2009,2008,2007,2006,2005,2004,2003,2002,1997,1996,1995,1994,1993,1992,1991,1990,1989,1988,1987,1986,1985,1984,1983,1981,1980,1979,1978,1977,1976,1975,1974,1973,1972
