29
/
en
AIzaSyAYiBZKx7MnpbEhh9jyipgxe19OcubqV5w
April 1, 2024
50412
Middle East & North Africa (IDA & IBRD countries)
TMN
false
2
1
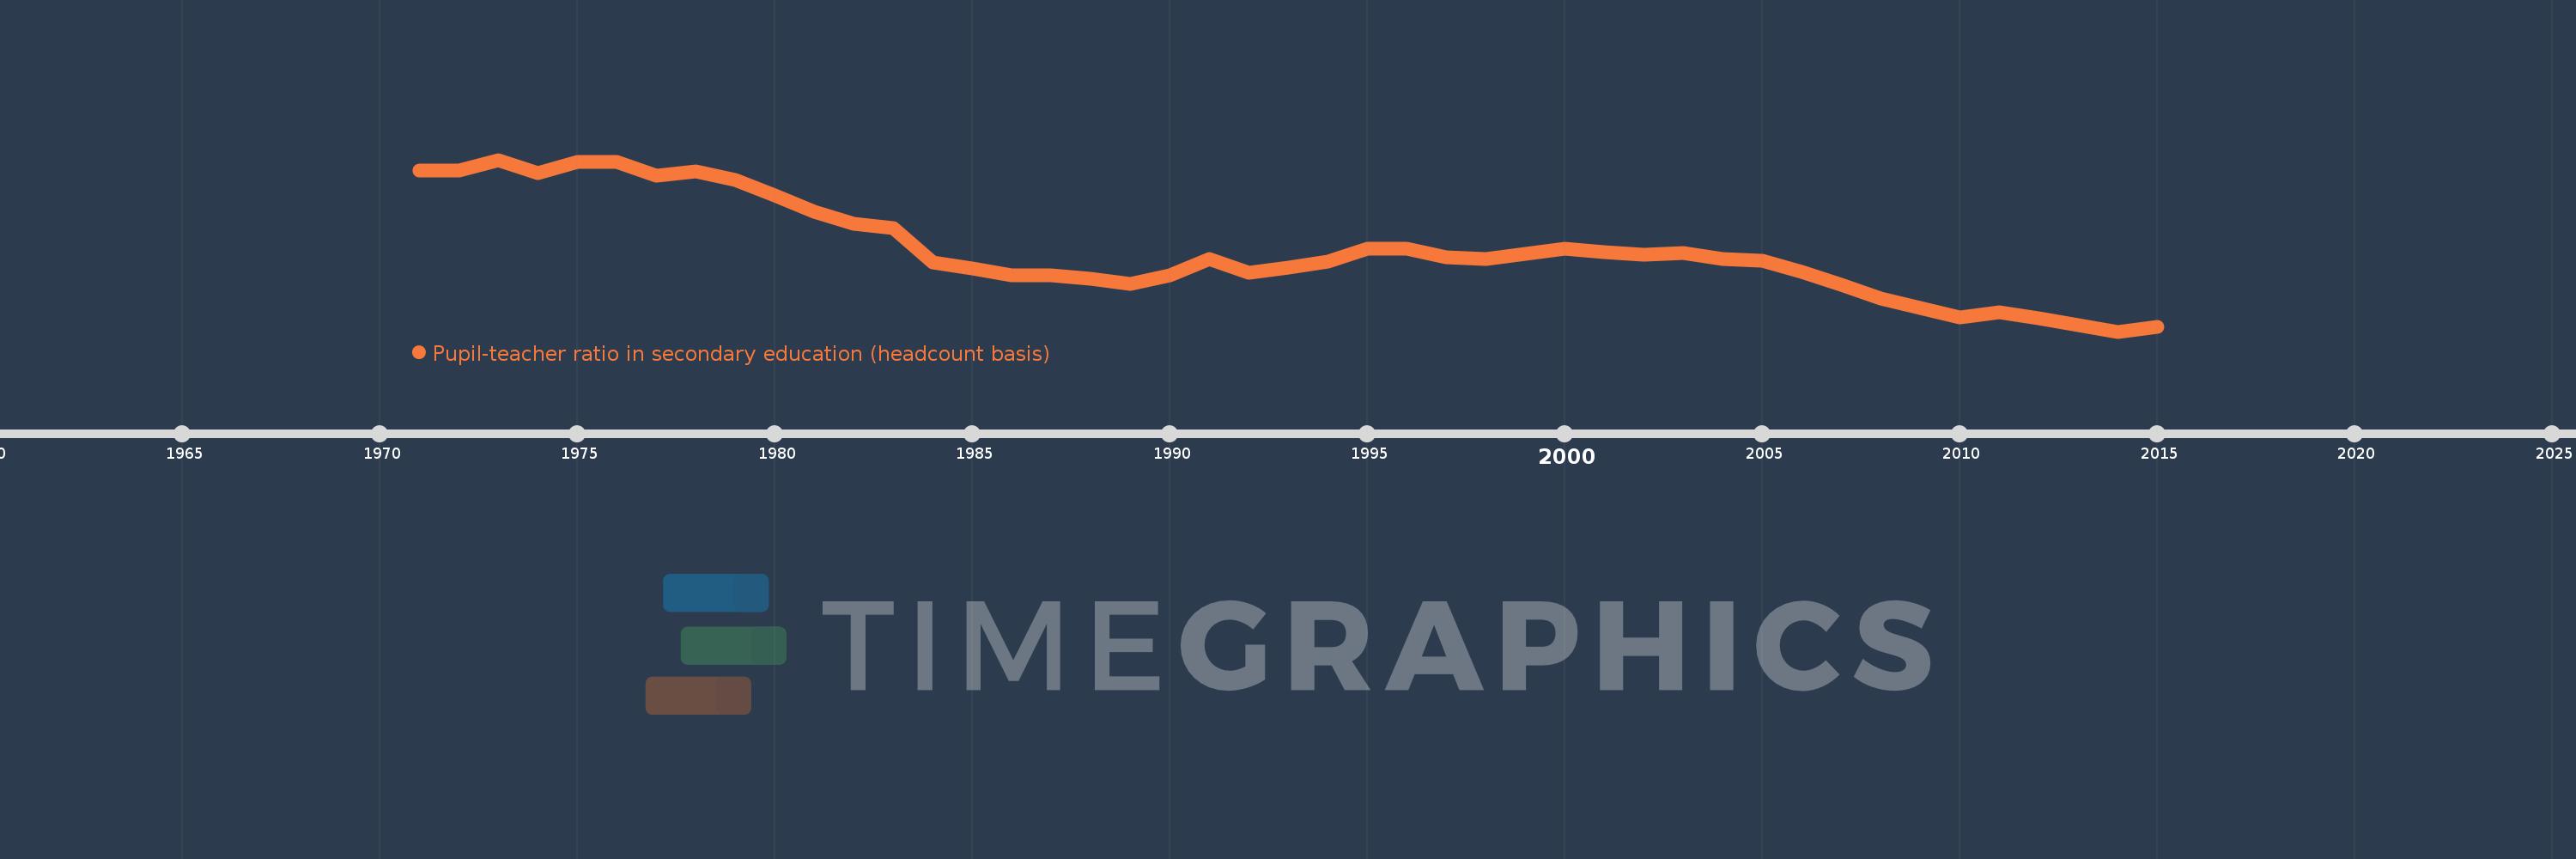
Pupil-teacher ratio in secondary education (headcount basis)
2015,2014,2013,2012,2011,2010,2009,2008,2007,2006,2005,2004,2003,2002,2001,2000,1999,1998,1997,1996,1995,1994,1993,1992,1991,1990,1989,1988,1987,1986,1985,1984,1983,1982,1981,1980,1979,1978,1977,1976,1975,1974,1973,1972,1971
This statistics in other country:
AfghanistanAlbaniaAlgeriaAndorraAngolaAntigua and BarbudaArab WorldArgentinaArmeniaArubaAustriaBahamas, TheBahrainBangladeshBarbadosBelarusBelgiumBelizeBeninBermudaBhutanBoliviaBosnia and HerzegovinaBotswanaBrazilBritish Virgin IslandsBrunei DarussalamBulgariaBurkina FasoBurundiCabo VerdeCambodiaCameroonCanadaCaribbean small statesCayman IslandsCentral African RepublicCentral Europe and the BalticsChadChileChinaColombiaComorosCongo, Dem. Rep.Congo, Rep.Costa RicaCote d'IvoireCroatiaCubaCyprusCzech RepublicDenmarkDjiboutiDominicaDominican RepublicEarly-demographic dividendEast Asia & PacificEast Asia & Pacific (excluding high income)East Asia & Pacific (IDA & IBRD countries)EcuadorEgypt, Arab Rep.El SalvadorEquatorial GuineaEritreaEstoniaEthiopiaEuro areaEurope & Central AsiaEurope & Central Asia (excluding high income)Europe & Central Asia (IDA & IBRD countries)European UnionFijiFinlandFragile and conflict affected situationsFranceGabonGambia, TheGeorgiaGermanyGhanaGibraltarGreeceGrenadaGuatemalaGuineaGuinea-BissauGuyanaHaitiHeavily indebted poor countries (HIPC)High incomeHondurasHong Kong SAR, ChinaHungaryIBRD onlyIcelandIDA & IBRD totalIDA blendIDA onlyIDA totalIndiaIndonesiaIran, Islamic Rep.IraqIrelandIsraelItalyJamaicaJapanJordanKazakhstanKenyaKiribatiKorea, Dem. People’s Rep.Korea, Rep.KuwaitKyrgyz RepublicLao PDRLate-demographic dividendLatin America & Caribbean Latin America & Caribbean (excluding high income)Latin America & the Caribbean (IDA & IBRD countries)LatviaLeast developed countries: UN classificationLebanonLesothoLiberiaLibyaLiechtensteinLithuaniaLow & middle incomeLow incomeLower middle incomeLuxembourgMacao SAR, ChinaMacedonia, FYRMadagascarMalawiMalaysiaMaldivesMaliMaltaMarshall IslandsMauritaniaMauritiusMexicoMiddle East & North AfricaMiddle East & North Africa (excluding high income)Middle East & North Africa (IDA & IBRD countries)Middle incomeMoldovaMonacoMongoliaMoroccoMozambiqueMyanmarNamibiaNauruNepalNetherlandsNew ZealandNicaraguaNigerNigeriaNorth AmericaNorwayOECD membersOmanOther small statesPacific island small statesPakistanPalauPanamaPapua New GuineaParaguayPeruPhilippinesPolandPortugalPost-demographic dividendPre-demographic dividendPuerto RicoQatarRomaniaRussian FederationRwandaSamoaSan MarinoSao Tome and PrincipeSaudi ArabiaSenegalSerbiaSeychellesSierra LeoneSingaporeSint Maarten (Dutch part)Slovak RepublicSloveniaSmall statesSolomon IslandsSomaliaSouth AfricaSouth AsiaSouth Asia (IDA & IBRD)SpainSri LankaSt. Kitts and NevisSt. LuciaSt. Vincent and the GrenadinesSub-Saharan Africa Sub-Saharan Africa (excluding high income)Sub-Saharan Africa (IDA & IBRD countries)SudanSurinameSwazilandSwedenSwitzerlandSyrian Arab RepublicTajikistanTanzaniaThailandTimor-LesteTogoTongaTrinidad and TobagoTunisiaTurkeyTurks and Caicos IslandsUgandaUkraineUnited Arab EmiratesUnited KingdomUnited StatesUpper middle incomeUruguayUzbekistanVanuatuVenezuela, RBVietnamWest Bank and GazaWorldYemen, Rep.ZambiaZimbabwe Timeline:
This timeline shows a graph from 1971 to 2015 of Middle East & North Africa (IDA & IBRD countries). No data until 1970. Number of actual observations by date: 45.
Source name:
World Development Indicators
Source organization:
UNESCO Institute for Statistics
Categories, topics:
Education
Last updated:
apr 23, 2017
Indicators value changes by year
Minimum:
15.762
jan 1, 2014
At the date of observation
Value
Absolute change
Change from previous value
jan 1, 1971
24.007
+24.007
0.0%
jan 1, 1972
24.008
+0.001
0.01%
jan 1, 1973
24.57
+0.561
2.34%
jan 1, 1974
23.87
-0.7
-2.85%
jan 1, 1975
24.461
+0.591
2.48%
jan 1, 1976
24.48
+0.019
0.08%
jan 1, 1977
23.754
-0.726
-2.97%
jan 1, 1978
23.982
+0.228
0.96%
jan 1, 1979
23.547
-0.435
-1.81%
jan 1, 1980
22.733
-0.815
-3.46%
jan 1, 1981
21.893
-0.84
-3.69%
jan 1, 1982
21.281
-0.612
-2.79%
jan 1, 1983
21.084
-0.197
-0.93%
jan 1, 1984
19.307
-1.777
-8.43%
jan 1, 1985
18.983
-0.325
-1.68%
jan 1, 1986
18.651
-0.332
-1.75%
jan 1, 1987
18.657
+0.006
0.03%
jan 1, 1988
18.458
-0.199
-1.07%
jan 1, 1989
18.207
-0.251
-1.36%
jan 1, 1990
18.649
+0.442
2.43%
jan 1, 1991
19.484
+0.834
4.47%
jan 1, 1992
18.785
-0.699
-3.59%
jan 1, 1993
19.029
+0.244
1.3%
jan 1, 1994
19.337
+0.308
1.62%
jan 1, 1995
19.996
+0.66
3.41%
jan 1, 1996
20.027
+0.031
0.16%
jan 1, 1997
19.589
-0.439
-2.19%
jan 1, 1998
19.464
-0.125
-0.64%
jan 1, 1999
19.753
+0.289
1.49%
jan 1, 2000
20.022
+0.269
1.36%
jan 1, 2001
19.85
-0.172
-0.86%
jan 1, 2002
19.722
-0.129
-0.65%
jan 1, 2003
19.786
+0.064
0.32%
jan 1, 2004
19.504
-0.281
-1.42%
jan 1, 2005
19.406
-0.098
-0.5%
jan 1, 2006
18.809
-0.597
-3.08%
jan 1, 2007
18.158
-0.651
-3.46%
jan 1, 2008
17.451
-0.707
-3.89%
jan 1, 2009
16.963
-0.489
-2.8%
jan 1, 2010
16.473
-0.49
-2.89%
jan 1, 2011
16.735
+0.262
1.59%
jan 1, 2012
16.461
-0.274
-1.63%
jan 1, 2013
16.089
-0.372
-2.26%
jan 1, 2014
15.762
-0.327
-2.03%
jan 1, 2015
15.997
+0.235
1.49%
Ranking of countries by current statistics by years


Comments: