29
/
en
AIzaSyAYiBZKx7MnpbEhh9jyipgxe19OcubqV5w
April 1, 2024
124150
Ecuador
ECU
true
2
1
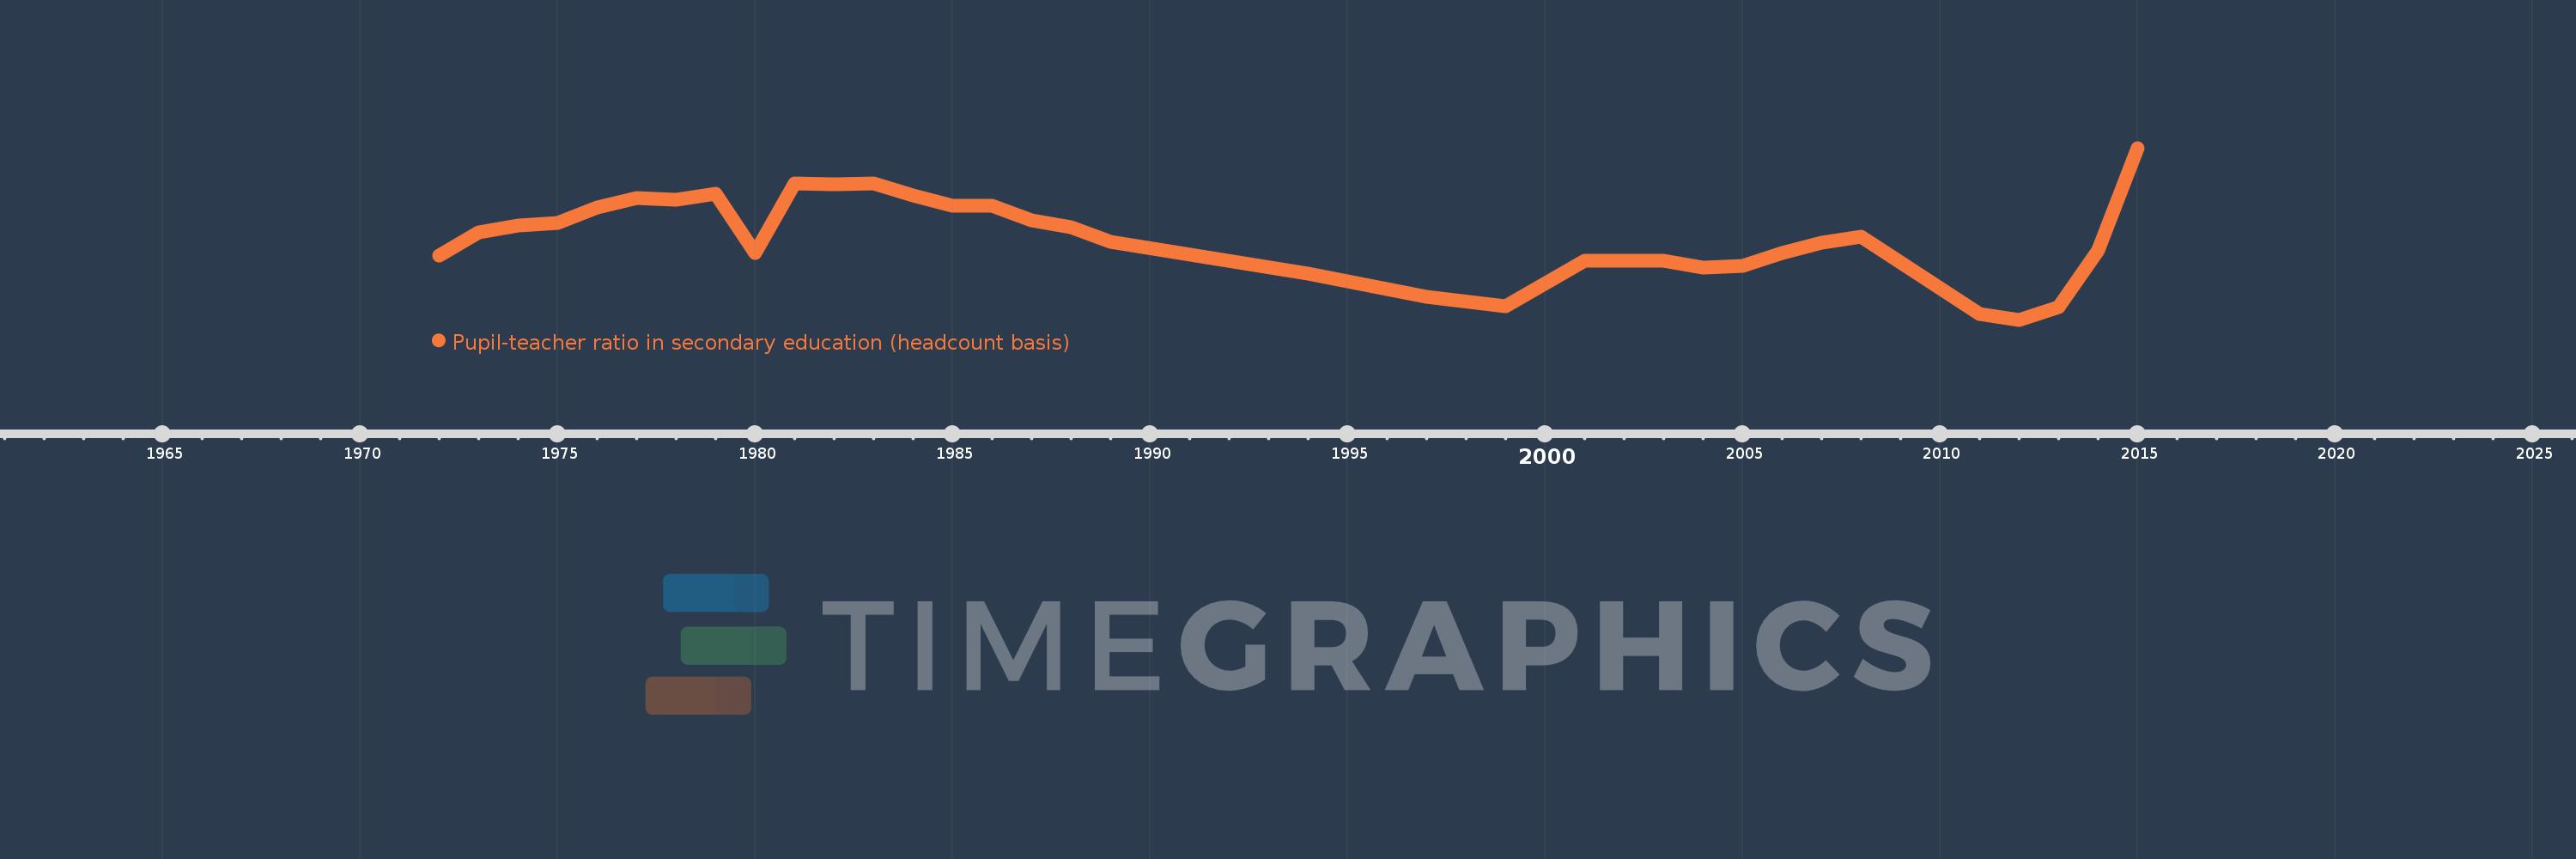
Pupil-teacher ratio in secondary education (headcount basis)
2015,2014,2013,2012,2011,2008,2007,2006,2005,2004,2003,2002,2001,1999,1997,1994,1989,1988,1987,1986,1985,1984,1983,1982,1981,1980,1979,1978,1977,1976,1975,1974,1973,1972
This statistics in other country:
AfghanistanAlbaniaAlgeriaAndorraAngolaAntigua and BarbudaArab WorldArgentinaArmeniaArubaAustriaBahamas, TheBahrainBangladeshBarbadosBelarusBelgiumBelizeBeninBermudaBhutanBoliviaBosnia and HerzegovinaBotswanaBrazilBritish Virgin IslandsBrunei DarussalamBulgariaBurkina FasoBurundiCabo VerdeCambodiaCameroonCanadaCaribbean small statesCayman IslandsCentral African RepublicCentral Europe and the BalticsChadChileChinaColombiaComorosCongo, Dem. Rep.Congo, Rep.Costa RicaCote d'IvoireCroatiaCubaCyprusCzech RepublicDenmarkDjiboutiDominicaDominican RepublicEarly-demographic dividendEast Asia & PacificEast Asia & Pacific (excluding high income)East Asia & Pacific (IDA & IBRD countries)EcuadorEgypt, Arab Rep.El SalvadorEquatorial GuineaEritreaEstoniaEthiopiaEuro areaEurope & Central AsiaEurope & Central Asia (excluding high income)Europe & Central Asia (IDA & IBRD countries)European UnionFijiFinlandFragile and conflict affected situationsFranceGabonGambia, TheGeorgiaGermanyGhanaGibraltarGreeceGrenadaGuatemalaGuineaGuinea-BissauGuyanaHaitiHeavily indebted poor countries (HIPC)High incomeHondurasHong Kong SAR, ChinaHungaryIBRD onlyIcelandIDA & IBRD totalIDA blendIDA onlyIDA totalIndiaIndonesiaIran, Islamic Rep.IraqIrelandIsraelItalyJamaicaJapanJordanKazakhstanKenyaKiribatiKorea, Dem. People’s Rep.Korea, Rep.KuwaitKyrgyz RepublicLao PDRLate-demographic dividendLatin America & Caribbean Latin America & Caribbean (excluding high income)Latin America & the Caribbean (IDA & IBRD countries)LatviaLeast developed countries: UN classificationLebanonLesothoLiberiaLibyaLiechtensteinLithuaniaLow & middle incomeLow incomeLower middle incomeLuxembourgMacao SAR, ChinaMacedonia, FYRMadagascarMalawiMalaysiaMaldivesMaliMaltaMarshall IslandsMauritaniaMauritiusMexicoMiddle East & North AfricaMiddle East & North Africa (excluding high income)Middle East & North Africa (IDA & IBRD countries)Middle incomeMoldovaMonacoMongoliaMoroccoMozambiqueMyanmarNamibiaNauruNepalNetherlandsNew ZealandNicaraguaNigerNigeriaNorth AmericaNorwayOECD membersOmanOther small statesPacific island small statesPakistanPalauPanamaPapua New GuineaParaguayPeruPhilippinesPolandPortugalPost-demographic dividendPre-demographic dividendPuerto RicoQatarRomaniaRussian FederationRwandaSamoaSan MarinoSao Tome and PrincipeSaudi ArabiaSenegalSerbiaSeychellesSierra LeoneSingaporeSint Maarten (Dutch part)Slovak RepublicSloveniaSmall statesSolomon IslandsSomaliaSouth AfricaSouth AsiaSouth Asia (IDA & IBRD)SpainSri LankaSt. Kitts and NevisSt. LuciaSt. Vincent and the GrenadinesSub-Saharan Africa Sub-Saharan Africa (excluding high income)Sub-Saharan Africa (IDA & IBRD countries)SudanSurinameSwazilandSwedenSwitzerlandSyrian Arab RepublicTajikistanTanzaniaThailandTimor-LesteTogoTongaTrinidad and TobagoTunisiaTurkeyTurks and Caicos IslandsUgandaUkraineUnited Arab EmiratesUnited KingdomUnited StatesUpper middle incomeUruguayUzbekistanVanuatuVenezuela, RBVietnamWest Bank and GazaWorldYemen, Rep.ZambiaZimbabwe Timeline:
This timeline shows a graph from 1972 to 2015 of Ecuador. No data until 1971. Number of actual observations by date: 34.
Source name:
World Development Indicators
Source organization:
UNESCO Institute for Statistics
Categories, topics:
Education
Last updated:
apr 23, 2017
Indicators value changes by year
At the date of observation
Value
Absolute change
Change from previous value
jan 1, 1972
13.805
+13.805
0.0%
jan 1, 1973
14.844
+1.039
7.53%
jan 1, 1974
15.144
+0.299
2.02%
jan 1, 1975
15.269
+0.125
0.83%
jan 1, 1976
15.969
+0.7
4.58%
jan 1, 1977
16.362
+0.393
2.46%
jan 1, 1978
16.295
-0.067
-0.41%
jan 1, 1979
16.584
+0.29
1.78%
jan 1, 1980
13.92
-2.665
-16.07%
jan 1, 1981
17.038
+3.119
22.41%
jan 1, 1982
16.977
-0.061
-0.36%
jan 1, 1983
17.014
+0.037
0.22%
jan 1, 1984
16.497
-0.517
-3.04%
jan 1, 1985
16.044
-0.453
-2.75%
jan 1, 1986
16.038
-0.006
-0.04%
jan 1, 1987
15.371
-0.666
-4.15%
jan 1, 1988
15.076
-0.295
-1.92%
jan 1, 1989
14.41
-0.666
-4.42%
jan 1, 1994
12.988
-1.422
-9.87%
jan 1, 1997
11.957
-1.031
-7.94%
jan 1, 1999
11.555
-0.403
-3.37%
jan 1, 2001
13.579
+2.025
17.52%
jan 1, 2002
13.578
-0.001
-0.01%
jan 1, 2003
13.577
-0.001
-0.01%
jan 1, 2004
13.274
-0.303
-2.23%
jan 1, 2005
13.343
+0.069
0.52%
jan 1, 2006
13.905
+0.561
4.21%
jan 1, 2007
14.362
+0.458
3.29%
jan 1, 2008
14.657
+0.295
2.06%
jan 1, 2011
11.188
-3.47
-23.67%
jan 1, 2012
10.94
-0.248
-2.21%
jan 1, 2013
11.52
+0.58
5.31%
jan 1, 2014
14.044
+2.524
21.91%
jan 1, 2015
18.61
+4.566
32.51%
Ranking of countries by current statistics by years


Comments: